
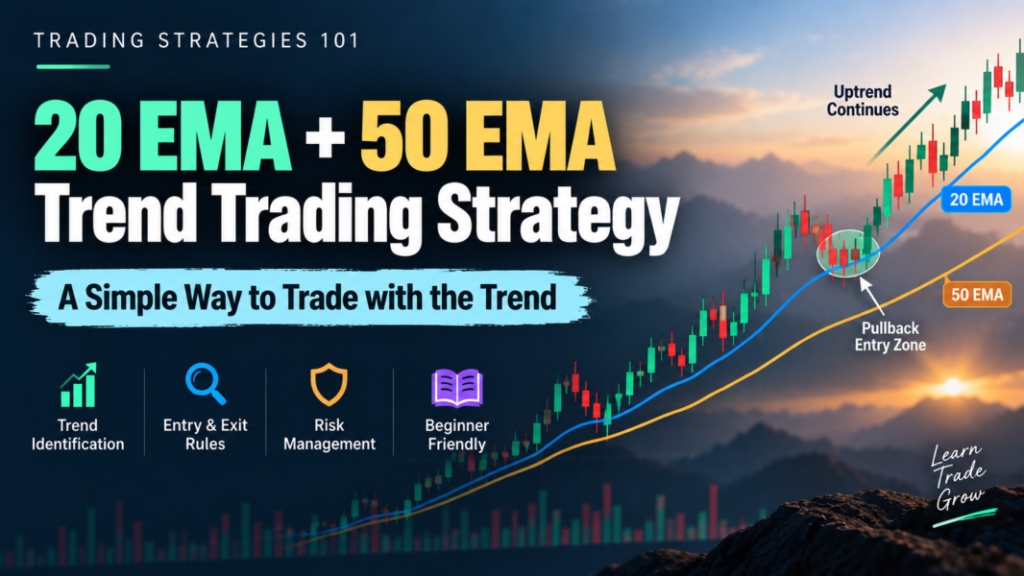
Strategy #2 – 20 EMA and 50 EMA Trend Trading Strategy for Beginners
The 20 EMA and 50 EMA trend trading strategy is a simple trend-following method used by traders to understand market direction and look for trading opportunities when price moves with an established trend.
Instead of trying to predict every market top or bottom, the idea is simpler: identify whether buyers or sellers are in control, wait for price to offer a reasonable setup, and manage the risk if the trade does not work.
That simplicity makes the setup popular among beginners. The two moving averages can quickly show whether price is trending upward, trending downward, or simply moving sideways.
But there is an important point.
Seeing the 20 EMA cross above the 50 EMA does not automatically mean “buy”. Similarly, a bearish crossover is not a reason to blindly short.
The quality of the trend, price structure, nearby support and resistance, candle behaviour and risk-to-reward all matter.
This article explains how the setup works, how entries and exits can be planned, where stop-losses may be placed, and why the strategy sometimes fails.
What Is the 20 EMA and 50 EMA Trend Trading Strategy for Beginners?
EMA stands for Exponential Moving Average.
A moving average smooths price data so that traders can understand the broader direction of a market without reacting to every small candle movement.
The EMA gives slightly more importance to recent prices than a simple moving average.
In this strategy, traders generally use:
- 20 EMA to represent the shorter-term trend
- 50 EMA to represent the broader trend
When the 20 EMA stays above the 50 EMA and both are moving upward, the market is generally showing bullish momentum.
When the 20 EMA remains below the 50 EMA and both slope downward, bearish momentum is stronger.
The real idea is not simply to trade every crossover.
A trader is trying to answer a more useful question:
Is the market trending clearly, and is price giving me a sensible opportunity to join that trend without chasing it?
That distinction is important.
Moving averages are based on past price data. They react to price; they do not predict what price must do next.
Exponential Moving Average (EMA) Explained – Fidelity
Quick Strategy Snapshot
| Factor | Details |
|---|---|
| Trading style | Intraday, swing and positional |
| Suitable market | Trending markets |
| Suggested timeframe | 15-minute and above; daily charts can suit swing traders |
| Indicators/tools | 20 EMA, 50 EMA, price action, support/resistance and optional volume |
| Difficulty | Beginner to intermediate |
| Risk level | Moderate; false signals can be frequent in sideways markets |
The timeframe should match the trader’s style.
A five-minute chart may produce many signals but also more market noise. A daily chart gives fewer signals but usually shows the broader trend more clearly.
How the Strategy Works
The basic logic begins with trend direction.
Imagine a stock is steadily making higher highs and higher lows.
As price rises, the faster 20 EMA generally reacts more quickly and moves above the slower 50 EMA.
If the trend remains healthy, price may occasionally pull back towards the 20 EMA or the area between the two moving averages.
Instead of buying after a sharp rally, a trader can watch that pullback.
If buyers return near the moving-average area and price begins moving upward again, the trader has more information than a simple crossover alone provides.
The sequence may look like this:
Trend → Pullback → Support near EMA zone → Price confirmation → Entry → Risk management
The bearish setup works in the opposite direction.
During a downtrend:
- the 20 EMA stays below the 50 EMA,
- both averages slope downward,
- price forms lower highs and lower lows,
- and rallies towards the EMA zone may attract fresh selling.
The EMAs therefore work better as a trend filter and dynamic reference area rather than as automatic buy and sell buttons.
Moving Averages in Technical Analysis – Fidelity
Chart Setup
Setting up the chart is straightforward.
Indicators Required
Add two exponential moving averages:
- 20-period EMA
- 50-period EMA
Most charting platforms such as TradingView and broker charting tools allow these settings.
Different colours can be used so the two averages are easy to distinguish.
Preferred Timeframes
There is no single best timeframe.
For educational testing, beginners can consider:
- 15-minute or 30-minute: intraday observation
- 1-hour: slower intraday or short swing setups
- Daily: swing and positional analysis
Very small timeframes such as one-minute charts tend to contain significantly more noise and may produce frequent false signals.
What Should Be Visible?
Keep the chart relatively clean.
You mainly need:
- price candles,
- 20 EMA,
- 50 EMA,
- important support and resistance,
- volume if you use it as confirmation.
Adding too many indicators can make a simple strategy unnecessarily confusing.
Entry Conditions
A good setup begins with trend quality, not with pressing the buy or sell button as soon as two lines cross.
Bullish or Long Setup
A potential bullish setup may develop when:
- The 20 EMA is above the 50 EMA.
- Both EMAs are preferably sloping upward.
- Price is generally forming higher highs and higher lows.
- Price pulls back towards the 20 EMA or the area between the 20 and 50 EMA.
- The pullback does not significantly damage the bullish structure.
- Price shows evidence that buyers are returning.
- There is enough room before the next major resistance to justify the planned risk.
For example, suppose a stock has been trending upward for several sessions.
Instead of buying when the stock is already far above its 20 EMA, a trader waits.
Price then pulls back towards the moving-average area and forms a bullish rejection candle.
That may be a more structured setup than chasing the earlier rally.
Bearish or Short Setup
A bearish setup follows the reverse logic:
- The 20 EMA is below the 50 EMA.
- Both averages are preferably sloping downward.
- Price is making lower highs and lower lows.
- Price rallies towards the EMA zone.
- The broader bearish structure remains intact.
- Price shows selling pressure near the moving averages.
- The next support level leaves reasonable space for the planned trade.
For Indian cash-market traders, short-selling rules and holding restrictions should always be understood before using bearish setups. Traders using derivatives should also understand their higher risk and contract characteristics.
Confirmation Before Entry
A moving average alone should not be the entire decision process.
Confirmation helps traders distinguish a genuine trend continuation from an ordinary price fluctuation.
Candle Close
One practical confirmation is waiting for a candle to close.
Suppose price temporarily moves above the EMA during a candle but finishes below it.
An intrabar entry could have produced a false signal.
Waiting for the close gives more information about whether buyers or sellers actually maintained control.
Price Action
Look at how price behaves around the moving-average zone.
For a bullish setup, traders may watch for:
- bullish rejection candles,
- a strong bullish close after the pullback,
- a higher low,
- a break above the pullback’s minor swing high.
For bearish setups, the opposite behaviour may provide confirmation.
Market Structure
Market structure is often more useful than the EMA crossover itself.
In an uptrend, ask:
Are higher highs and higher lows still intact?
If price has already broken an important swing low, the earlier trend may be weakening even if the 20 EMA has not yet crossed below the 50 EMA.
Remember that moving averages lag behind price.
Support and Resistance
Suppose a bullish entry appears at ₹500 but major resistance sits at ₹504 while the stop-loss needs to be ₹490.
You would be risking ₹10 per share for only ₹4 of obvious upside before resistance.
That is not an attractive setup simply because the EMA alignment looks bullish.
Volume
Volume can be useful, particularly when price resumes the trend after a consolidation or crosses an important level.
However, volume should be treated as supporting evidence rather than a mandatory signal in every EMA trade.
Higher-Timeframe Trend
A 15-minute bullish setup can be more difficult when the daily chart is in a strong downtrend.
Some traders therefore check one higher timeframe before entering.
For example:
- trade setup: 15-minute chart
- trend context: 1-hour chart
The higher timeframe does not need to produce an identical signal, but understanding the larger structure can prevent trading blindly against a stronger trend.
Stop-Loss Placement
Stop-loss placement should relate to the reason for taking the trade.
For a bullish setup, a logical stop may be placed below:
- the recent swing low,
- the pullback low,
- or an important support structure.
For a bearish setup, the stop may sit above the recent swing high or the level that would invalidate the bearish idea.
Avoid choosing a random stop such as “₹5 below my entry” without checking the chart.
Suppose you enter because a higher low suggests the uptrend remains intact.
If price later breaks decisively below that higher low, the original trade idea may no longer be valid.
That is why structure-based stops are useful.
The EMA itself should not automatically become the stop-loss in every trade. Price can briefly move through an EMA and still continue its broader trend.
Target and Exit Strategy
There are several ways traders can plan an exit.
The important part is deciding the approach before entering, rather than making emotional decisions after price starts moving.
Fixed Risk-to-Reward
If ₹100 is being risked, a trader using a 1:2 risk-to-reward plan would look for approximately ₹200 of potential reward.
This does not mean the target will always be reached.
It simply creates a consistent framework.
Previous Support or Resistance
Existing chart levels can also be used.
For a long trade, the next major resistance or previous swing high may become a potential target.
For a short trade, previous support can serve the same purpose.
Trailing Stop
During a strong trend, traders sometimes trail the stop below successive higher lows for long positions or above lower highs for bearish positions.
This allows some room for a larger move while still controlling risk.
Indicator-Based Exit
Another approach is to reduce or exit a position if:
- price begins closing consistently on the wrong side of the EMA zone,
- the 20 EMA loses its slope,
- or the 20 EMA eventually crosses back through the 50 EMA.
The disadvantage is that moving averages are lagging indicators, so this method can return part of an open profit before signalling an exit.
Partial Profit Booking
Some traders may exit part of the position at an initial target and manage the remainder using a trailing stop.
This approach should also be tested in advance rather than changed randomly from trade to trade.
Risk-Reward Example
Here is a simple hypothetical educational example.
Entry: ₹500
Stop-loss: ₹490
Risk: ₹10 per share
Target using 1:2 risk-to-reward: ₹520
If the trader buys 20 shares:
Total planned risk = ₹10 × 20 = ₹200
Potential reward at ₹520 = ₹20 × 20 = ₹400, before brokerage, taxes, slippage and other trading costs.
This calculation does not tell us whether the trade will win.
It tells us how much is being risked relative to the planned reward.
Practical Indian Market Example
Consider a hypothetical example using Tata Motors shares. The prices below are purely illustrative and are not a current trading recommendation.
Assume the stock is trading around ₹1,000.
Setup
On the hourly chart:
- 20 EMA is above the 50 EMA.
- Both averages are rising.
- Price has been making higher highs and higher lows.
- The stock rallies to around ₹1,040 and then starts pulling back.
Confirmation
Price falls towards ₹1,010, close to the EMA zone.
Instead of immediately buying, the trader waits.
A bullish candle forms near this area and closes strongly around ₹1,018. Price also holds above the previous important swing low.
This suggests that buyers may still be defending the broader uptrend.
Entry
A trader studying this setup might consider an educational entry around ₹1,020 after confirmation.
Stop-Loss
The recent swing low is around ₹1,000.
A stop could therefore be planned slightly below the structure, depending on the exact chart.
Assume an illustrative stop at ₹998.
Risk per share:
₹1,020 − ₹998 = ₹22
Target
Suppose previous resistance is around ₹1,065.
That provides potential upside of ₹45 per share.
The approximate reward-to-risk would therefore be slightly above 2:1.
If resistance were instead sitting at ₹1,030, the setup would be much less attractive because the potential reward would be small compared with the risk.
Exit
If price reaches the resistance zone, the trader may book profits or trail the stop.
If price falls and invalidates the higher-low structure, the predefined stop controls the loss.
Again, these numbers are hypothetical. The example is designed to explain the process, not predict Tata Motors’ future price.
When This Strategy Works Best
EMA trend strategies generally become more useful when the market has a clear directional move.
Established Trend
The cleanest environment is usually when:
- 20 EMA and 50 EMA are clearly separated,
- both have a noticeable slope,
- price structure agrees with the trend.
Pullback Within a Trend
A controlled pullback towards the moving averages can offer a better location than entering after several large trend candles.
Consolidation Followed by Trend Continuation
Sometimes a stock pauses after an initial move.
If it consolidates, holds its broader trend structure and later resumes the move with confirmation, the EMAs can help keep the trader aligned with the dominant direction.
Liquid Stocks and Indices
Highly liquid NSE stocks, Nifty 50 and Bank Nifty generally provide cleaner execution than thinly traded securities.
Liquidity does not remove trading risk, but it can reduce some problems associated with large bid-ask spreads and poor execution.
When to Avoid This Strategy
Knowing when not to trade the setup can be just as useful as recognising a potential entry.
Sideways or Choppy Markets
When price repeatedly moves above and below both averages, the market may not have a clear trend.
The 20 and 50 EMA can cross each other several times.
This is one of the most common environments for false signals.
Flat Moving Averages
When both EMAs are almost horizontal and tangled together, there may be little directional momentum.
A crossover in this situation carries less information than one occurring during a genuine trend.
Price Is Already Extended
Suppose the 20 EMA is above the 50 EMA, but price has moved sharply upward and is far away from both averages.
Buying purely because the trend is bullish may mean chasing after much of the move has already happened.
Waiting for a better setup may provide a more logical risk level.
Major Event Volatility
Results announcements, RBI decisions, government announcements, global events or unexpected news can create unusually large moves.
Technical levels can fail quickly during such periods.
Poor Risk-to-Reward
Even a technically valid trend setup may not make sense if major resistance is immediately above the proposed entry.
The chart should offer enough room relative to the stop-loss.
False Signals and Strategy Limitations
No EMA combination can reliably predict every market move.
The biggest weakness comes from the fact that moving averages are lagging indicators.
The crossover happens only after price has already moved.
During sideways markets, price can repeatedly move above and below both averages. This produces what traders often call whipsaws.
Another problem occurs after sudden price movements.
A stock may rally sharply, causing the 20 EMA to move above the 50 EMA. If the move quickly reverses, anyone who entered late based only on the crossover can get trapped.
News events can also invalidate an otherwise clean technical setup.
Transaction costs, slippage, execution quality and emotional discipline can further affect real-world performance.
A strategy should therefore be judged over a meaningful sample of trades rather than after one winning trade or two losing trades.
Losses are a normal part of trading.
The objective of risk management is not to eliminate losses. It is to keep individual losses manageable enough that one bad trade does not cause disproportionate damage.
Common Mistakes Beginners Make
Entering Immediately After Every Crossover
A crossover is information, not a complete trading setup.
Check trend structure, slope, price location and nearby support or resistance.
Chasing Price
If price is already far away from the 20 EMA after several strong candles, the stop-loss may become too wide while the remaining upside becomes limited.
Ignoring Market Structure
Price behaviour matters more than the appearance of two indicator lines.
If important support has already broken, the bullish trend may be weakening before the EMA crossover shows it.
Using an Extremely Tight Stop
Placing the stop directly underneath the 20 EMA simply because it is the 20 EMA can result in normal price fluctuations stopping the trade.
Stops should reflect market structure and position size.
Oversized Positions
A technically good setup can still create a damaging loss if the position is too large.
The position size should come from the amount you are prepared to lose — not from how confident the setup feels.
Moving the Stop-Loss to Avoid Taking a Loss
If the chart invalidates the original setup, widening the stop simply increases the loss.
Changing risk after entering should not become a method of avoiding discipline.
Position Sizing and Risk Management
Before entering a trade, decide the maximum amount you are prepared to lose if the setup fails.
Assume a trader has ₹1,00,000 of trading capital and, purely as an example, chooses to limit one trade’s risk to ₹500.
Suppose:
Entry = ₹500
Stop-loss = ₹490
Risk per share = ₹10
Position size based on the planned risk:
₹500 ÷ ₹10 = 50 shares
The calculation is simple, but it changes the decision-making process.
Instead of first deciding to buy 500 shares and then wondering where the stop should go, the trader:
- identifies the logical stop,
- calculates the risk per share,
- decides the maximum acceptable total loss,
- calculates the position size.
This is a much more disciplined approach.
There is no need to use excessive leverage to make a trend-following strategy meaningful.
Higher leverage also magnifies losses.
Backtesting the Strategy
Before using real money, test the rules on historical charts.
A basic backtesting process can look like this:
- Choose one liquid instrument, such as Nifty 50 or a liquid NSE stock.
- Select one timeframe.
- Define your entry rules clearly.
- Define exactly where the stop-loss will go.
- Decide how targets or exits will be handled.
- Review a meaningful number of historical setups.
- Record every qualifying trade, not only the attractive winners.
- Track wins and losses.
- Record average reward-to-risk.
- Track losing streaks and drawdowns.
- Note whether the setup performs differently in trending and sideways markets.
For example, a trading journal might record whether the 20 EMA was above the 50 EMA, whether both were sloping, the type of pullback, the entry, stop, target and final result.
After enough observations, patterns become easier to identify.
Perhaps the setup performs poorly when the EMAs are flat.
Perhaps entries taken after deep pullbacks behave differently from shallow pullbacks.
That information is far more useful than relying on a few screenshots showing successful trades.
Paper trading or market simulation can then help test execution before risking real capital.
Remember that backtested performance can differ from live trading because of slippage, transaction costs, execution delays and changing market conditions.
Simple Trading Checklist
Before entering, ask:
- Is the 20 EMA clearly above or below the 50 EMA?
- Are both averages actually sloping in the trend direction?
- Does price structure agree with the EMA trend?
- Am I entering after a sensible pullback rather than chasing price?
- Has price shown confirmation?
- Is there major support or resistance nearby?
- Does the setup offer acceptable reward relative to the stop?
- Is my stop based on market structure?
- Have I calculated the position size before entering?
- Am I comfortable accepting the planned loss if the trade fails?
- Is the market unusually volatile because of a major event?
If several answers are unclear, the setup may simply not be ready.
Advantages and Limitations
| Advantages | Limitations |
|---|---|
| Easy to understand visually | Moving averages react after price moves |
| Helps identify trend direction | Frequent whipsaws in sideways markets |
| Can be used across several timeframes | Crossovers alone produce weak signals |
| Encourages trading with the broader trend | Sharp reversals can invalidate setups |
| Can combine well with price structure | Requires disciplined stop-loss management |
| Rules can be backtested | Results vary by instrument and timeframe |
Who Is This Strategy Suitable For?
Beginners
Beginners may find the strategy useful because the chart remains simple.
However, they should first learn support, resistance, swing highs, swing lows and basic risk management rather than focusing only on EMA crossovers.
Intraday Traders
Intraday traders can use the EMAs as a directional filter on 15-minute, 30-minute or similar charts.
More frequent trading generally means more noise, so confirmation becomes important.
Swing Traders
The setup can fit swing trading because pullbacks within established daily or hourly trends are easy to study visually.
Positional Traders
Longer-term traders can apply the same concept to daily or weekly charts, although signals will naturally develop more slowly.
Experienced Traders
Experienced traders may combine moving averages with broader market structure, relative strength, volume or other tools.
The basic concept remains the same: an EMA should support the trading decision, not replace it.
Key Takeaway
The 20 EMA and 50 EMA setup is best understood as a trend-following framework, not a crossover prediction system.
The 20 EMA helps show shorter-term momentum, while the slower 50 EMA provides broader trend context. When the two averages, price structure and price action agree, traders can look for controlled pullbacks instead of chasing every move.
The quality of the entry matters, but risk management matters just as much.
Define the stop before entering. Calculate the position size from the acceptable loss. Check the available reward. And accept that some technically valid setups will still fail.
Consistency comes from following tested rules across many trades, not from expecting every individual trade to work.
Frequently Asked Questions
Q1. Is the 20 EMA and 50 EMA strategy good for beginners?
It can be beginner-friendly because only two indicators are required. Beginners should still understand price structure, stop-loss placement and position sizing before trading with real money.
Q2. Is a 20 EMA crossing above the 50 EMA automatically a buy signal?
No. A crossover only indicates a change in recent price behaviour. Trend structure, EMA slope, price location, support and resistance and confirmation should also be considered.
Q3. Which timeframe is best for the 20 EMA and 50 EMA?
There is no universal best timeframe. Intraday traders may study 15-minute to hourly charts, while swing traders commonly study hourly or daily charts. The timeframe should match the trader’s plan and should be tested historically.
Q4. Can this strategy work in sideways markets?
It generally becomes less reliable in sideways markets because the two EMAs can repeatedly cross each other and produce false signals. Clear trending conditions tend to suit the method better.
Q5. Should volume be used with the EMA strategy?
Volume can provide useful supporting information, especially during trend continuation or breaks of important levels, but it is not a guarantee that a setup will succeed.
Further Reading
Strategy #1 – Support and Resistance Breakout Strategy for Beginners
Stock Market 101 – Lesson 40: Long-Term Wealth Habits
Stock Market 101 – Lesson 38: Tax-Saving Instruments Overview
Stock Market 101 – Lesson 37: Mutual Fund Mistakes
Educational Disclaimer
This article is for educational and informational purposes only and should not be considered investment or trading advice. Stock-market trading involves risk, and historical examples or past performance do not guarantee future results.
Article Information
Author: Kartalks Education Desk
Reviewed by: Kartalks Editorial Team
Content Type: Stock market education, trading strategy guide, EMA trend-following strategy, 20 EMA and 50 EMA explanation, entry and exit awareness, stop-loss planning, risk management, false signal risk, and trader education
Sources: SEBI investor education material, NSE/BSE educational resources, stock exchange learning resources, technical analysis references, official public sources, and general finance education references
Last Updated: September 19, 2026
In Dept and In Detail.
Good Brush up.
Thanks for posting. Appreciated.
Thank you for your kind feedback! We’re glad you found the strategy detailed and useful as a refresher.
* In Depth.
Thank you for your kind feedback! We’re glad you found the strategy detailed and useful as a refresher.
Very very useful information, seems like 90% traders do nit follow this and are in loss due to that.
Thank you! We’re glad you found the information useful. Disciplined risk management and following a well-defined strategy are important for every trader.