
Trading Strategy #1 – Support and Resistance Breakout Strategy for Beginners
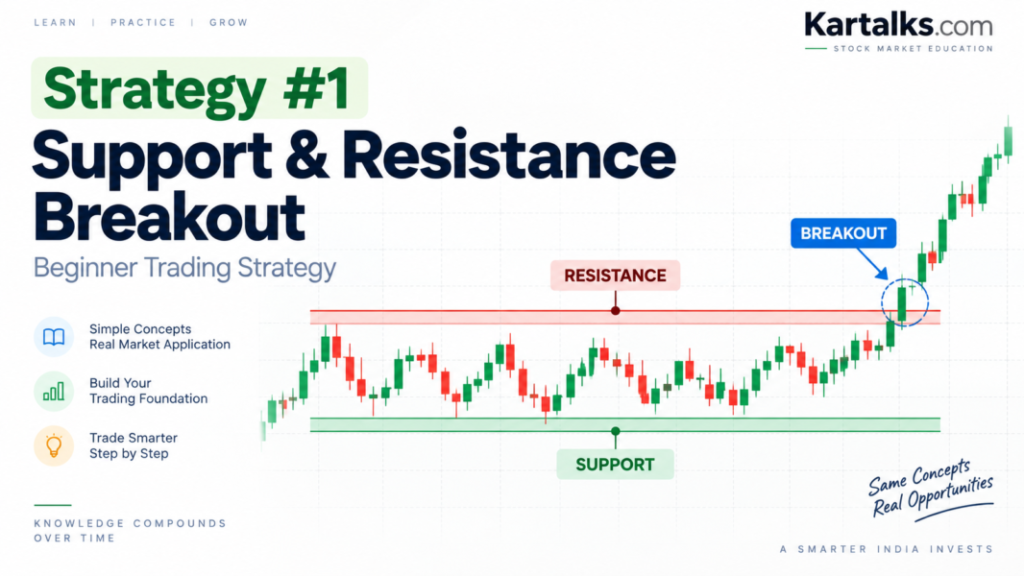
A Support and Resistance Breakout Strategy for Beginners is one of the simplest ways to understand how price reacts around important chart levels. The idea is straightforward: when price repeatedly struggles to move beyond a particular level and later breaks it with strength, traders watch for a possible move in the direction of that breakout.
Simple does not mean easy.
A line drawn on a chart is not automatically a trade signal. Prices can briefly move beyond support or resistance and then reverse. These false breakouts are one of the biggest challenges for new traders.
That is why learning how to identify the level, wait for confirmation, control risk and recognise weak setups is far more useful than blindly buying whenever price crosses resistance or selling whenever support breaks.
The strategy can be studied by intraday, swing and positional traders. It is especially useful for beginners because it introduces several basic trading concepts at the same time: market structure, price action, volume, stop-loss placement, risk-reward and position sizing.
What Is Support and Resistance Breakout Strategy for Beginners?
Support and resistance are price zones where buyers or sellers have previously become active.
Support is an area where falling prices have repeatedly found buying interest.
Resistance is an area where rising prices have repeatedly faced selling pressure.
Imagine an NSE-listed stock repeatedly reaching ₹500 but failing to move above it. Traders may begin treating the ₹500 area as resistance.
If the stock later closes clearly above ₹500 with strong participation, the market may be signalling that sellers around that price are no longer strong enough to contain buyers.
That is a resistance breakout.
The opposite applies to support.
If a stock repeatedly finds buyers around ₹450 but later closes below that level with strong selling pressure, traders may study it as a bearish breakdown.
The important point is that support and resistance are better treated as zones rather than perfectly exact prices. Markets rarely respect every level to the last paisa.
A breakout strategy attempts to participate when price moves out of such a well-established zone and starts a fresh directional move.
Support and Resistance Basics – Investopedia
Quick Strategy Snapshot
| Factor | Details |
|---|---|
| Trading style | Intraday, swing and positional |
| Suitable market | Trending markets and breakouts from consolidation ranges |
| Suggested timeframe | 15-minute or higher for beginners; daily charts for swing trading |
| Indicators/tools | Price chart, horizontal levels and volume; indicators are optional |
| Difficulty | Beginner to intermediate |
| Risk level | Moderate because false breakouts can occur |
How the Strategy Works
Before thinking about entry prices, understand what is happening between buyers and sellers.
Suppose Nifty 50 approaches the same resistance area several times.
Each time price reaches that area, sellers appear and price falls.
The level becomes visible to many market participants.
Eventually, one of three things may happen:
- Price continues to remain below resistance.
- Price briefly crosses resistance and falls back below it.
- Buyers absorb the selling pressure and price moves decisively above resistance.
The third situation is what breakout traders are looking for.
A genuine breakout often represents a change in market behaviour.
Traders who were selling near resistance may start covering their positions. Traders waiting for confirmation may enter. Momentum traders may also participate.
Together, this can create additional demand.
The bearish version works in the opposite direction when support fails.
Still, a breakout itself is not enough. Confirmation matters because markets frequently move slightly beyond obvious levels before reversing.
Chart Setup
One advantage of this strategy is that beginners do not need a chart filled with indicators.
Required tools
Keep the chart simple:
- Candlestick chart
- Horizontal support and resistance zones
- Volume, where meaningful
- Clearly visible recent swing highs and swing lows
No indicator is mandatory.
An optional moving average, such as the 20-period EMA, can be used as a basic trend reference, but it should not replace price structure.
Preferred timeframe
For beginners, very low timeframes such as one-minute charts may create too much noise.
A practical starting point could be:
- 15-minute or 30-minute chart: intraday study
- 1-hour chart: short swing setups
- Daily chart: swing and positional setups
Higher timeframes usually contain fewer random fluctuations than extremely short charts.
Preparing the chart
Before searching for a breakout:
- Zoom out and identify obvious swing highs and lows.
- Mark areas where price has reacted more than once.
- Treat them as zones, not razor-thin lines.
- Observe whether price is consolidating near the level.
- Check the broader trend.
- Wait for price to approach the zone naturally.
Do not keep adding dozens of lines. If every price becomes support or resistance, the chart stops being useful.
Entry Conditions
Entry rules should be defined before the trade appears.
Bullish or Long Breakout Setup
For educational purposes, a reasonable bullish setup may require:
- A visible resistance zone with at least two meaningful previous reactions.
- Price approaches resistance without becoming excessively extended.
- A candle closes above the resistance zone.
- The breakout candle shows reasonable strength rather than only a long upper wick.
- For stocks, volume is preferably stronger than recent average volume.
- Price does not immediately collapse back below resistance.
- Entry is considered either:
- above the breakout candle high, or
- after a successful retest of the old resistance zone.
The second approach is more conservative.
After a breakout, old resistance can sometimes act as new support. A successful retest provides extra evidence that buyers are defending the area.
Bearish or Short Breakout Setup
A bearish breakdown may require:
- A visible support zone with repeated previous reactions.
- Price approaches the support without already being heavily oversold or extended.
- A candle closes below the support zone.
- The candle shows clear selling pressure.
- Volume, where available, supports the move.
- Price does not immediately recover above support.
- Entry may be studied:
- below the breakdown candle low, or
- after price retests the broken support and fails to recover above it.
Bearish trades should only be considered through instruments and market segments where short selling is permitted and appropriate for the trader.
Confirmation Before Entry
Why wait for confirmation?
Because price crossing a line during a candle is very different from price closing beyond the level.
Candle close
A candle close above resistance provides stronger evidence than an intraday spike above resistance.
Similarly, a bearish setup is stronger when price closes below support rather than temporarily trading below it.
Breakout candle structure
Look at the candle itself.
A strong bullish breakout candle generally closes closer to its high.
A candle with a very long upper wick may indicate that sellers pushed price back down.
Volume
Volume can help confirm participation in stock breakouts.
If a liquid NSE stock breaks resistance while trading substantially higher volume than during the preceding consolidation, the move deserves more attention than a breakout occurring on unusually weak volume.
For spot indices such as Nifty 50, direct index volume is not available in the same way as it is for an individual stock, so traders may rely more on price structure and related market information.
Trend direction
Breakouts in the direction of a larger trend can sometimes offer cleaner structures.
For example, if a stock has been forming higher highs and higher lows on the daily chart, a breakout from a short consolidation may fit the broader bullish structure.
Higher-timeframe levels
A breakout on a 15-minute chart may look attractive until you notice major daily resistance slightly above it.
Always zoom out before taking a setup.
Stop-Loss Placement
A stop-loss should be linked to the reason for taking the trade.
Suppose a trader enters after a bullish resistance breakout and retest.
The trade idea assumes that the old resistance has started acting as support.
If price falls clearly below that zone again, the original idea is becoming weaker.
A logical stop may therefore sit below:
- the breakout zone,
- the retest low, or
- another nearby structural swing low.
For a bearish breakdown, the stop may be placed above:
- the broken support zone,
- the retest high, or
- a nearby swing high.
Avoid choosing stop-loss distance only because a number such as ₹5, ₹10 or 20 points feels convenient.
The market structure should define the invalidation level first. Position size can then be adjusted according to that risk.
Target and Exit Strategy
There is no single exit method that suits every breakout.
Traders may study several approaches.
Fixed risk-reward
A trader might require at least 1:2 reward-to-risk before entering.
If ₹10 per share is being risked, the planned reward would need to be around ₹20 per share for a 1:2 setup.
Previous market structure
The next major support or resistance can be used as a potential exit area.
This approach respects what the chart is showing rather than choosing an arbitrary target.
Trailing stop
If price moves strongly after the breakout, the stop can gradually follow:
- higher swing lows in a bullish trade, or
- lower swing highs in a bearish trade.
Partial profit booking
Some traders exit part of the position at an initial objective and trail the remaining quantity.
Whatever method is selected, define the risk and basic exit plan before entering, not after the trade starts moving.
Risk-Reward Example
Hypothetical educational example only:
Entry: ₹500
Stop-loss: ₹490
Risk: ₹10 per share
Target using 1:2 risk-reward: ₹520
Here the trader risks ₹10 per share for a possible ₹20 reward.
If the planned target were only ₹505, the trader would be risking ₹10 to potentially gain ₹5. Even an attractive-looking breakout may not be worth taking when the reward-to-risk profile is poor.
Practical Indian Market Example
Consider a hypothetical NSE-listed stock called ABC Ltd.
Assume it has repeatedly faced resistance around ₹1,000.
It reaches ₹995–₹1,000 three times over several sessions but fails to close above the area.
The ₹1,000 zone becomes visible resistance.
Setup
ABC Ltd. begins consolidating between ₹970 and ₹1,000.
Instead of repeatedly falling sharply from ₹1,000, the pullbacks become smaller.
This may indicate that sellers near resistance are being absorbed.
Confirmation
A daily candle closes at ₹1,018.
The candle has a reasonably strong body and the stock records higher-than-usual volume.
The next session opens near ₹1,015 and briefly moves towards ₹1,005.
Buyers appear again around the old resistance zone.
Entry
A trader studying the retest approach may consider an educational entry around ₹1,020 after price starts moving back upward.
Stop-loss
Suppose the retest low is around ₹1,002.
A structural stop might be placed slightly below the invalidation area, for example around ₹998.
Risk per share would therefore be approximately ₹22.
Target
At a 1:2 reward-to-risk ratio:
Risk = ₹22
Potential reward = ₹44
Educational target area = around ₹1,064.
The trader may also check whether another major resistance zone appears before ₹1,064. If strong resistance exists at ₹1,045, the original trade may no longer offer an attractive reward-to-risk profile.
This example is hypothetical and does not represent a recommendation or prediction for any listed security.
When This Strategy Works Best
Breakout setups tend to become more interesting when several conditions come together.
Clear consolidation
A stock that has traded in a narrow range for several sessions may attract attention when it finally leaves that range.
Strong participation
For stocks, higher volume during the breakout can indicate that more market participants are involved.
Breakout in the broader trend direction
A bullish breakout within an established uptrend may have better structural support than a random breakout against a strong downtrend.
Repeated testing of a level
Repeated pressure on resistance or support can sometimes weaken the level.
For example, if buyers repeatedly push a stock towards resistance and each decline becomes smaller, demand may be building.
Clean retest
A breakout followed by a controlled retest and rejection from the old level can give traders a clearer place for both entry and stop-loss.
When to Avoid This Strategy
Not every breakout deserves a trade.
Very low-volume stocks
Low-liquidity shares can move sharply because of a small number of orders. Slippage may also become a problem.
Choppy market conditions
When price repeatedly crosses above and below the same level, breakout signals lose quality.
Major event volatility
RBI policy announcements, company results, major global events or unexpected news can cause unusually sharp moves and reversals.
Beginners may prefer to avoid entering immediately before such events.
Poor reward-to-risk
A breakout may occur directly into another major resistance level.
If there is not enough room for price to move before hitting the next obstacle, skipping the setup may make more sense.
Price already extended
If a stock has already moved sharply before crossing resistance, chasing the breakout may result in a poor entry.
Weak candle confirmation
A brief spike above resistance followed by a close back inside the range is not a clean breakout.
False Signals and Strategy Limitations
False breakouts are part of this strategy.
Suppose resistance sits at ₹800.
Price moves to ₹808 during the session, attracting breakout buyers.
It then falls and closes at ₹792.
That move above ₹800 did not develop into a sustained breakout.
Why does this happen?
Several reasons are possible:
- Buyers may lack follow-through.
- Large sellers may become active above resistance.
- Short-term traders may book profits.
- Broader market direction may suddenly change.
- News may alter sentiment.
- The level itself may have been poorly identified.
Waiting for a candle close, observing volume and checking higher-timeframe structure can reduce some weak trades, but no confirmation method eliminates false signals completely.
Losses therefore remain part of trading.
The strategy should be judged across a meaningful series of trades, not by whether one breakout worked or failed.
Common Mistakes Beginners Make
Entering before the breakout candle closes
Beginners often see price moving above resistance and immediately enter.
Minutes later, the candle closes back inside the range.
Chasing a large breakout candle
If price has already moved far beyond resistance, the stop may become too wide while the remaining upside becomes smaller.
Missing a trade is often better than forcing a poor entry.
Drawing too many levels
Not every small high or low is important support or resistance.
Focus on areas that produced clear market reactions.
Ignoring the larger trend
A small bullish breakout directly below major weekly resistance may be weaker than it appears on a short-term chart.
Increasing quantity because a setup “looks perfect”
There is no perfect breakout.
Position size should be based on risk, not confidence.
Moving the stop-loss farther away
Once the trade invalidation level has been decided, widening the stop just to avoid taking a loss changes the original risk plan.
Position Sizing and Risk Management
Risk management begins before clicking Buy or Sell.
First decide the maximum amount you are prepared to lose if the trade fails.
Suppose a trader has decided that the maximum acceptable loss on one educational setup is ₹1,000.
Entry price: ₹500
Stop-loss: ₹490
Risk per share = ₹10.
Position size can be estimated as:
₹1,000 ÷ ₹10 = 100 shares
So 100 shares would represent approximately ₹1,000 of planned price risk, excluding brokerage, taxes, slippage and other transaction costs.
If the stop needed to be ₹20 away instead, the quantity would need to fall to 50 shares to maintain roughly the same risk.
This is one reason position sizing matters.
The question should not be:
“How many shares can I afford to buy?”
A better question is:
“How much can I afford to lose if this setup fails?”
Beginners should also be cautious with derivative exposure. A larger position can magnify losses just as quickly as gains.
Backtesting the Strategy
Before risking real money, test the rules on historical charts.
Choose one liquid instrument first. It could be a Nifty 50 stock, Nifty 50 itself or another actively traded instrument.
Then:
- Choose one timeframe.
- Define exactly what qualifies as support and resistance.
- Define what counts as a valid candle close.
- Decide whether volume confirmation is required.
- Define entry rules.
- Define stop-loss placement.
- Define the exit method.
- Review a meaningful number of historical setups.
- Record every result, including losing trades.
- Track average reward-to-risk and drawdowns.
- Note the market conditions in which false breakouts occurred most often.
Do not remove losing trades from the test simply because they look obvious afterwards.
That creates unrealistic results.
After chart backtesting, consider paper trading or simulation. It can help identify problems with execution, hesitation, chasing entries and changing rules during a trade.
Support and Resistance – Fidelity Learning Center
Simple Trading Checklist
Before considering a breakout setup, ask:
- Is the support or resistance zone clearly visible?
- Has price reacted there more than once?
- Has the candle actually closed beyond the level?
- Does the breakout candle show reasonable strength?
- Is volume supportive, where applicable?
- Does the higher timeframe conflict with the setup?
- Is price already too extended?
- Is there enough room before the next major level?
- Is the stop-loss based on market structure?
- Is the planned reward worth the risk?
- Has position size been calculated before entry?
- Am I entering because of the setup rather than fear of missing out?
If several answers are unclear, there may be no need to trade.
Advantages and Limitations
| Advantages | Limitations |
|---|---|
| Easy for beginners to understand | False breakouts are common |
| Works without complex indicators | Levels can be subjective |
| Can be studied across several timeframes | Late entries may produce poor risk-reward |
| Provides logical stop-loss zones | Choppy markets create repeated false signals |
| Useful for intraday and swing analysis | News-driven volatility can disrupt setups |
| Encourages understanding of price structure | Requires patience and disciplined execution |
Who Is This Strategy Suitable For?
Beginners
Yes, provided they first learn support, resistance, candlestick closes, risk-reward and position sizing.
Intraday traders
It can be used for breakouts from opening ranges, intraday consolidation or important support and resistance zones.
Short timeframes contain more noise, so discipline becomes especially important.
Swing traders
This strategy fits swing trading well because daily and hourly charts often make market structure easier to identify.
Positional traders
Longer-term breakouts from weekly or multi-month ranges can also be studied using the same basic logic.
Experienced traders
Experienced traders may combine breakout structure with market breadth, volatility, sector strength, order-flow observations or other tools.
The basic principle remains the same: price must prove that the old level has been broken before the trader assumes a new move has started.
Key Takeaway
The Support and Resistance Breakout Strategy for Beginners is less about predicting exactly where the market will move and more about reacting when price behaviour changes around an important level.
A good breakout setup usually starts with a clearly defined support or resistance zone. Confirmation, market structure and sensible reward-to-risk matter more than entering as quickly as possible.
False breakouts cannot be completely avoided. That makes stop-loss placement, position sizing and consistency essential parts of the method.
For a beginner, the goal should first be to identify valid setups correctly and manage risk consistently. Profitability, if it comes, should be evaluated over many properly executed trades rather than one winning example.
Frequently Asked Questions
Q1. Is a candle moving above resistance enough to confirm a breakout?
No. Many traders prefer waiting for the candle to close above resistance because temporary intraday moves can reverse before the candle closes.
Q2. Is volume compulsory for a breakout strategy?
Not always, but volume can provide useful confirmation in liquid stocks. Price structure remains the primary element of the setup.
Q3. Should beginners enter immediately after a breakout?
Not necessarily. Waiting for a confirmed candle close or a successful retest can help beginners avoid some weak breakouts.
Q4. Which timeframe is best for beginners?
A 15-minute or higher timeframe is usually easier to study than very short charts. Daily charts are useful for learning swing-trading setups.
Q5. Can support and resistance breakout trading still produce losses?
Yes. False breakouts, unexpected news and changing market conditions can cause losses even when the setup appears valid. Risk management remains necessary on every trade.
Further Reading
Large-Cap vs Mid-Cap vs Small-Cap Mutual Funds
Stock Market 101 – Lesson 35: Mutual Fund Metrics Made Simple
Jio Platforms IPO Gets SEBI Nod: Expected Price, Valuation and Impact on Reliance Shares
Cautious Indian Markets Weekly View Sept 15–18, 2026
Rupee Fall 2026 Explained: Why INR May Stay Weak Against Dollar
Disclaimer
This article is intended only for educational and informational purposes and should not be treated as personalised investment or trading advice. Stock-market trading involves financial risk, and historical chart behaviour or hypothetical examples do not guarantee future results. Readers should conduct their own research, understand the risks involved and consider consulting a SEBI-registered financial adviser where appropriate before making financial decisions.
Article Information
Author: Kartalks Education Desk
Reviewed by: Kartalks Editorial Team
Content Type: Stock market education, trading strategy guide, support and resistance explanation, breakout trading basics, entry and stop-loss awareness, false breakout risk, and trader education
Sources: SEBI investor education material, NSE/BSE educational resources, stock exchange learning resources, technical analysis references, official public sources, and general finance education references
Last Updated: September 14, 2026