risk management

Position sizing, stop-losses, volatility awareness, and rules that protect your downside.

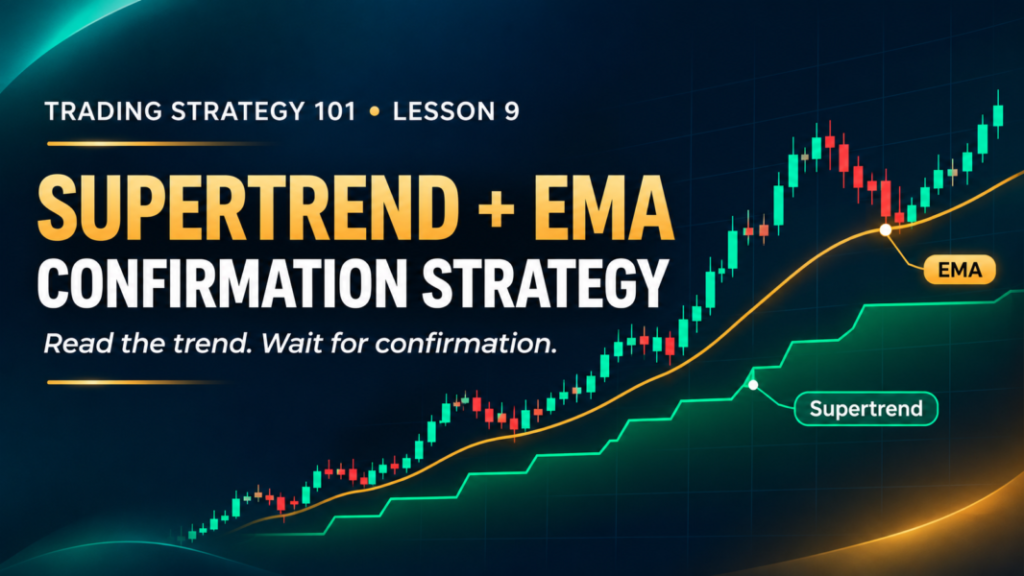
Supertrend + EMA confirmation strategy chart showing a stock pullback towards the EMA with Supertrend below price

Trading Strategy 101 – Lesson 9: Supertrend + EMA Confirmation Strategy

A beginner-friendly guide to using Supertrend and the EMA together to assess trend setups, plan entries and manage the risk of false signals.

Trading Strategy 101 – Lesson 9: Supertrend + EMA Confirmation Strategy Read More »

Bollinger Band Mean-Reversion Strategy chart showing a possible bounce from the lower band towards the middle band

Trading Strategy 101 – Lesson 8: Bollinger Band Mean-Reversion Strategy

A beginner-friendly guide to trading range reversals with Bollinger Bands, including chart setup, practical examples and situations where the strategy can fail.

Trading Strategy 101 – Lesson 8: Bollinger Band Mean-Reversion Strategy Read More »

Previous day high and low strategy banner showing candlesticks between two price levels and a breakout above the upper boundary.

Trading Strategy 101 – Lesson 7: Previous Day High and Low Strategy

Yesterday’s high and low give intraday traders two clear reference points. Learn how to assess breakouts, wait for retest confirmation, recognise false signals and plan risk before entering.

Trading Strategy 101 – Lesson 7: Previous Day High and Low Strategy Read More »

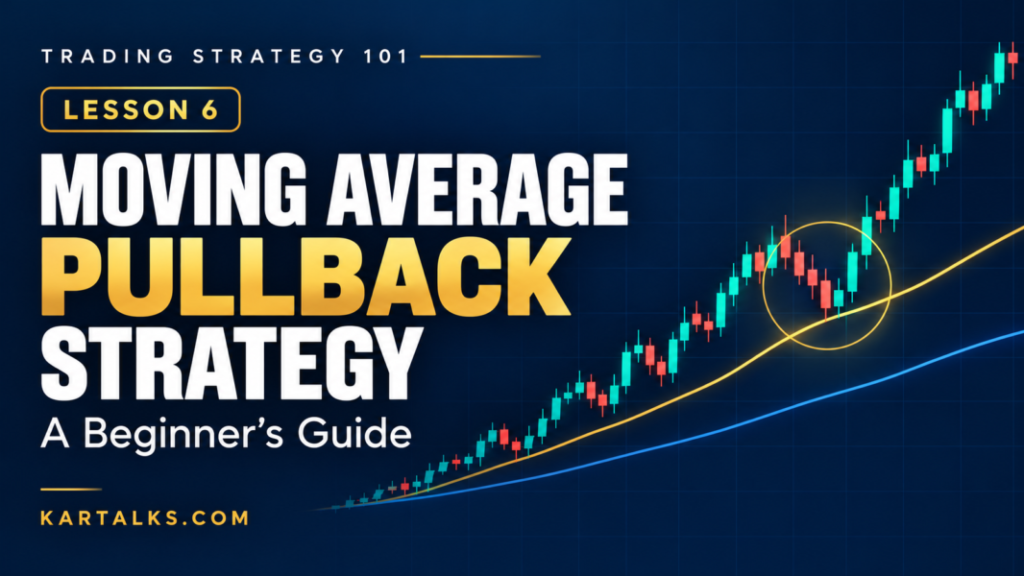
Moving average pullback strategy illustration showing candlesticks returning towards a rising moving average, with Lesson 6 branding.

Trading Strategy 101 – Lesson 6: Moving Average Pullback Strategy

A stock touching its moving average is not automatically a buying opportunity. Learn how to assess the trend, wait for confirmation and manage risk with a practical pullback trading framework.

Trading Strategy 101 – Lesson 6: Moving Average Pullback Strategy Read More »

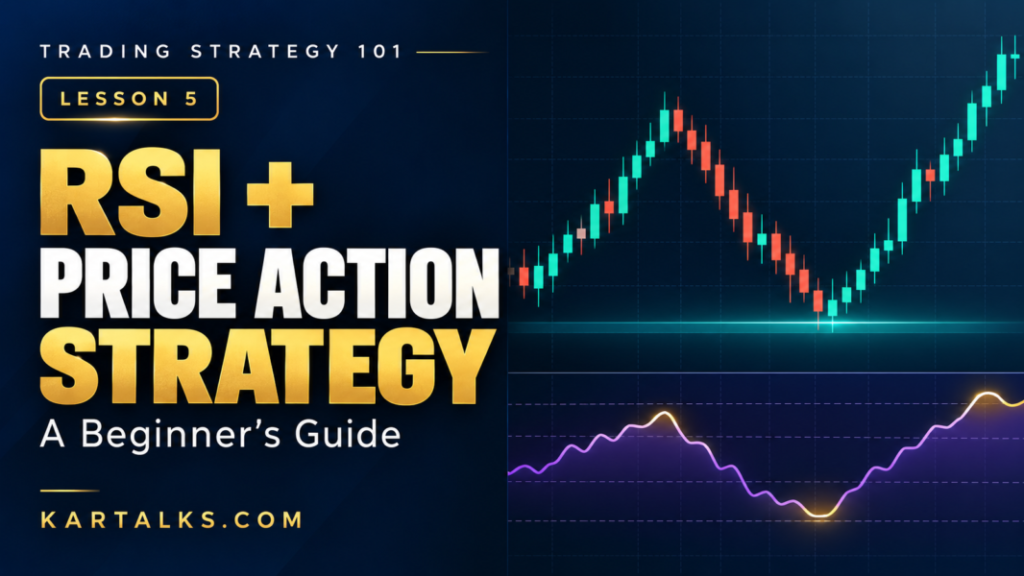
RSI + price action trading strategy banner with candlesticks, an RSI-style curve and Lesson 5 branding.

Trading Strategy 101 – Lesson 5: RSI + Price Action Trading Strategy

RSI below 30 does not automatically mean it is time to buy. Learn how to combine momentum, support and resistance, and price confirmation to assess a setup and plan your risk.

Trading Strategy 101 – Lesson 5: RSI + Price Action Trading Strategy Read More »

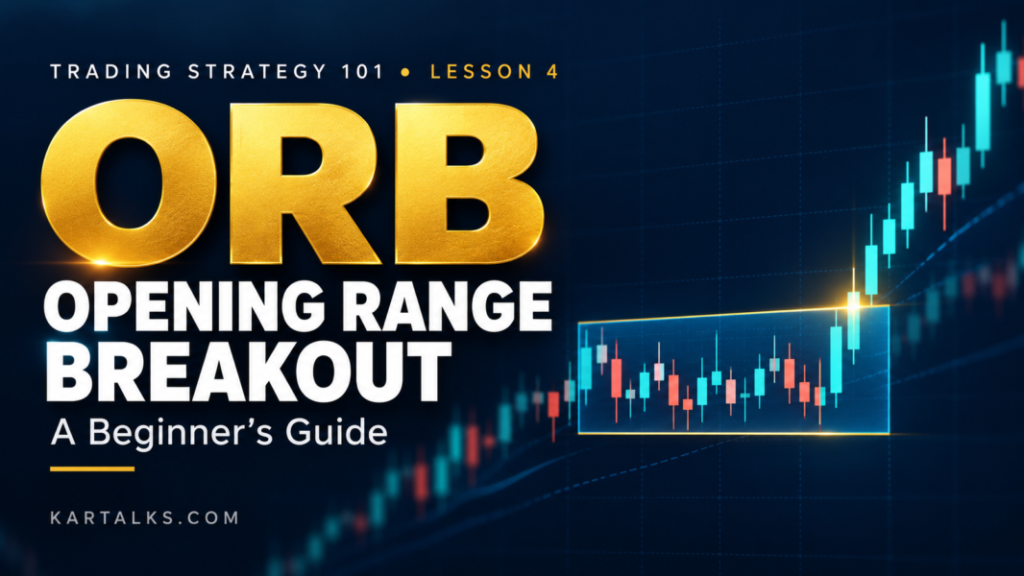
Opening range breakout strategy banner with candlesticks breaking above a highlighted price range.

Trading Strategy 101 – Lesson 4: Opening Range Breakout (ORB) Strategy

The first few minutes of trading can be confusing. Learn how to mark the opening range, assess a breakout and retest, plan your stop-loss and recognise when a trade is better skipped.

Trading Strategy 101 – Lesson 4: Opening Range Breakout (ORB) Strategy Read More »

Scroll to Top