
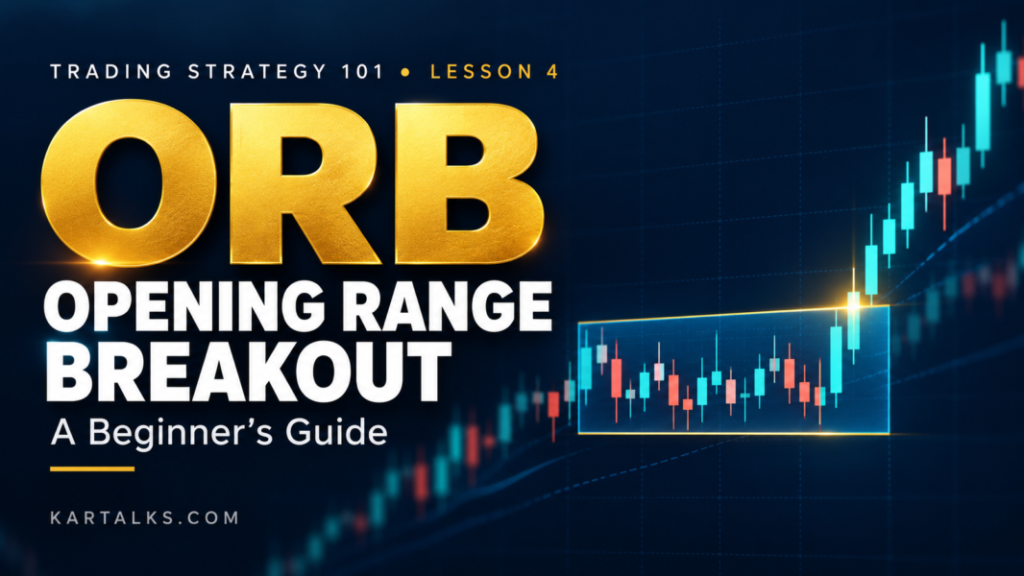
Trading Strategy 101 – Lesson 4: Opening Range Breakout (ORB) Strategy for Beginners
The market opens, a stock jumps, and within minutes it gives back most of the move. Just when you decide to stay away, it starts climbing again.
The first few minutes can be confusing. Overnight news, orders placed before the open and fresh buying or selling all meet at once. For a beginner, the temptation is to chase whichever candle looks strongest.
The Opening Range Breakout (ORB) strategy offers a way to organise that morning activity. You let a fixed period pass, mark its highest and lowest prices, and then watch what happens outside those boundaries.
Intraday traders use this approach to look for a directional move after the initial trading settles. It can help readers who prefer clear price levels and can follow the market during the morning.
But a breakout is only a possibility. Understanding the setup—and knowing when to skip it—matters far more than buying every move above a line.
What Is the Opening Range Breakout Strategy?
The opening range is the distance between the highest and lowest prices recorded during a chosen period at the start of the session.
If you choose 15 minutes, you use everything traded during those first 15 minutes. Some traders use shorter or longer windows. The important point is to choose the window beforehand and keep it consistent.
A move above the range high is an upside breakout. A move below the range low is a downside breakout. The trading idea is that price may continue in that direction as fresh orders arrive.
This lesson uses a 15-minute opening range followed by a breakout and retest. A retest means price returns to the broken boundary before attempting to move away again.
The rules are an educational framework to practise and test. They are not a proven profit formula.
Zerodha: Understanding the Opening Range Breakout (ORB) strategy
Quick Strategy Snapshot
| Factor | Details |
|---|---|
| Trading style | Intraday |
| Suitable market | Directional sessions with follow-through after a breakout |
| Opening range | First 15 minutes of normal trading |
| Chart timeframe | 5-minute candles; daily chart for nearby major levels |
| Indicators/tools | Price chart, two horizontal lines and optional volume |
| Difficulty | Beginner-friendly concept; execution needs practice |
| Risk level | Significant; false breakouts and fast reversals can cause losses |
How the Strategy Works
Let the opening range finish
For normal NSE equity trading, the session opens at 9:15 AM IST. A 15-minute range therefore covers 9:15 AM up to, but not including, 9:30 AM. Special sessions can have different timings.
On a 5-minute chart, use the first three completed candles: 9:15–9:20, 9:20–9:25 and 9:25–9:30.
Mark the highest wick and the lowest wick across all three. Do not use only their closing prices.
Watch for a move outside it
Once the range is complete, leave those lines fixed.
An upside breakout tells you that price has moved beyond the morning’s initial high. It does not tell you whether enough buying will follow to keep the move going.
That distinction is why we wait for a completed candle outside the range.
See whether the broken level holds
For a long setup, watch whether the old range high acts as support during a return towards it. For a short setup, watch whether the range low acts as resistance.
The retest gives you a fresh turning point to assess. It can also provide a more manageable stop distance than placing the stop across the entire opening range.
Not every breakout comes back for a retest. Under this version, that means no trade.
NSE India: Official market timings for identifying the opening range
Chart Setup
You do not need a special indicator to identify the opening range.
Prepare the chart with:
- 5-minute candlesticks, using the correct exchange timezone.
- Two horizontal lines for the opening high and low.
- Volume bars, if available for the instrument.
- Previous day’s high and low, plus obvious nearby support and resistance.
Check the daily chart before the open. A stock may break its opening high while still sitting just below a level that has rejected price several times.
Keep the display readable. VWAP can be an optional filter, but it is not required for the rules in this lesson.
The opening range here uses normal-session trades. Do not mix pre-open auction prices into it.
Entry Conditions
To keep the example testable, use the following timing rules:
- Look for setups only after 9:30 AM.
- Allow no new entry at or after 11:00 AM.
- Take a maximum of one filled trade per stock per day.
- After a breakout candle closes, allow the next three candles for a retest.
These are practice rules, not exchange requirements or claims about the best trading window.
Bullish or long setup
- Wait for a completed 5-minute candle to close above the opening-range high.
- Within the next three candles, look for one whose high-to-low range touches or crosses that boundary.
- That retest candle must close above the boundary and above its own opening price.
- Consider entry only when the immediately following candle trades above the retest candle’s high.
- Plan the stop below the retest candle’s low, with a small, predefined allowance.
- Check that the next marked resistance leaves room for at least twice the planned risk.
Cancel the pending setup if a candle closes back inside the opening range before entry. Also cancel it if price breaches the planned stop before triggering entry, or the next candle never triggers.
If price opens far beyond the intended entry, reassess the actual entry-to-stop distance. Do not assume the original risk calculation still applies.
Bearish or short setup
Reverse the sequence:
- A completed candle closes below the opening-range low.
- Within the next three candles, price returns to that boundary.
- The retest candle closes below the boundary and below its opening price.
- The following candle trades below the retest candle’s low.
- The planned stop sits above the retest candle’s high.
- The next support leaves enough room for the required reward.
Apply the same cancellation rules in reverse.
For ordinary intraday cash-market short selling, the shares need to be bought back the same day. Check your broker’s current eligibility rules and square-off deadline.
Zerodha Varsity: How short selling works for bearish trading setups
Confirmation Before Entry
A wick outside the range can disappear quickly. A candle close gives you more information, although it still cannot guarantee continuation.
For this version, the retest is the main confirmation. You are checking whether price can hold outside the range after returning to its boundary.
Volume can support the reading. A breakout with stronger participation deserves attention, but compare it sensibly. Opening candles often have unusually high volume; a later breakout does not automatically fail just because its volume is lower than the first candle’s.
Market direction matters too. A stock breaking upwards while its sector and the broader market are falling may face extra resistance. Treat that as context to record and test.
Finally, check the next obstacle. A confirmed breakout into nearby resistance can still offer a poor trade.
Stop-Loss Placement
The stop should reflect the reason for taking the trade.
In this retest approach, a long trade depends on buyers defending the broken range high. A move below the retest low weakens that idea, so the stop goes just below that low.
For a short, place it just above the retest high.
The small allowance beyond the candle should account for the instrument’s tick size, spread and usual movement. Decide how you will calculate it before testing; do not change it whenever a trade looks appealing.
Another ORB variation places the stop beyond the opposite side of the opening range. That allows more room but can create a much larger rupee risk. It is a different version and needs separate testing.
If the stop distance is too large, reduce the quantity or skip. A stop order can also execute at a worse price during a fast move, so the planned loss is not a guaranteed limit.
Target and Exit Strategy
Define the risk before entering. Then check whether the chart offers enough room for the target.
For this lesson, use a target of twice the initial risk, often called 2R. If entry is ₹6 above the stop in a long trade, the target is ₹12 above entry.
Other approaches include exiting near a previous high or low, or trailing the stop behind fresh swing points. Partial booking is another option, but it changes the average reward achieved.
Choose one exit method for your test. Switching between them after seeing the price move makes the results difficult to interpret.
For the worked example, use the original stop, a fixed 2R target and a time exit at 3:00 PM IST, or earlier if required by the broker. The time is a practice choice. Close at that time even if neither price level has been reached.
Risk-Reward Example
Hypothetical example for education:
- Entry: ₹500
- Stop-loss: ₹494
- Risk per share: ₹6
- Target at 1:2 risk-reward: ₹512
- Potential reward per share: ₹12
With 25 shares, the planned price-based loss is ₹150 and the target profit is ₹300, before charges and slippage.
A 1:2 ratio does not make a trade automatically worthwhile. Results also depend on how often targets are reached, the size of actual losses and trading costs.
Practical Indian Market Example
Consider SBI on an imaginary trading day. Every price below is hypothetical and is not a current quotation or recommendation.
Setup
Between 9:15 and 9:30 AM, SBI trades between ₹800 and ₹810.
The opening-range low is ₹800, the high is ₹810, and the width is ₹10. At 9:30, those boundaries are fixed.
Confirmation
The 9:35–9:40 candle closes at ₹812, above the ₹810 boundary.
The next candle pulls back. It opens at ₹811, trades down to ₹809.50, reaches ₹812.50 and closes at ₹812.
It has tested ₹810 and finished above both that level and its opening price. There is no intervening close back inside the range.
Entry
During the following candle, price moves above the retest high of ₹812.50. Assume the actual entry is ₹813.
Before entry, the trader has checked the next marked resistance, which is around ₹825 in this example.
Stop-loss
The stop is ₹809, below the retest low of ₹809.50.
The ₹0.50 allowance is illustrative, not a standard SBI setting.
Risk per share = ₹813 − ₹809 = ₹4
Target or exit
A 2R target is ₹821, leaving space before the marked resistance.
If the target is reached first, the gross gain is ₹8 per share. If the stop fills at ₹809 first, the loss is ₹4 per share. If neither happens before the time exit, the position closes at the available price then.
Now imagine that resistance had been ₹817 instead. That leaves only ₹4 of room against ₹4 of risk. Under these rules, the trader would skip the entry.
The breakout may look identical, but the available reward changes the decision.
When This Strategy Works Best
This approach is intended for sessions where price moves beyond the opening range and continues to attract orders in that direction.
Useful conditions to study include:
- An orderly opening range followed by a clear expansion in price.
- A breakout with a controlled retest.
- Reasonable liquidity and a manageable bid–ask spread.
- Space before the next major support or resistance.
- A stock and broader market moving in the same direction.
An opening range need not be extremely narrow. It should simply allow a sensible trade under your rules. Whether a particular range size improves results is something to test.
When to Avoid This Strategy
The opening range is unusually wide
A large early move may have already covered much of the distance the stock typically travels. It can also leave an awkward stop distance or nearby resistance.
Price repeatedly crosses both boundaries
This suggests indecision. Taking every breakout can produce several losses while the stock goes nowhere.
The breakout candle is already far from the range
A late entry may leave most of the movement behind you. Wait for the planned retest; if it never comes, let the trade go.
Liquidity or confirmation is weak
Wide spreads, thin trading and candles that repeatedly retreat into the range make execution and interpretation harder.
A major announcement is approaching
An RBI decision, company announcement or sudden headline can overwhelm the setup. A technically tidy chart does not protect against new information.
Also skip trades with poor reward relative to risk or signals that arrive after your entry cutoff.
False Signals and Strategy Limitations
An opening-range high is a reference level, not a barrier the market must respect.
Price can break above it, attract buyers and then fall back inside. The retest may look convincing and still fail. In a choppy session, both the high and low can break without a lasting move in either direction.
Waiting for a retest introduces another limitation: some genuine trend days will run away without offering an entry.
The chosen opening window also changes the signals. A breakout from a 5-minute range may still be inside a 30-minute range. Neither window is automatically correct for every instrument.
Losses are part of the method. Evaluate consistent rules over many trades rather than judging them by one impressive winner or a disappointing morning.
Zerodha Varsity: Trading ranges, breakouts and false breakout risks
Common Mistakes Beginners Make
A frequent mistake is marking the range before the opening window has finished. The next candle can change both boundaries.
Other habits to watch for:
- Using candle bodies while ignoring wicks.
- Redrawing the opening range after a breakout fails.
- Treating a brief price spike as a confirmed close.
- Entering late because the move looks too strong to miss.
- Ignoring nearby support or resistance.
- Increasing quantity after a losing trade.
- Moving the stop farther away to avoid booking a loss.
- Applying stock-chart targets directly to option premiums.
If you later trade an index derivative, test that actual instrument. A spot-index move does not translate directly into an equal change in an option’s price.
Position Sizing and Risk Management
Choose your maximum acceptable rupee loss before entering.
Quantity = Planned rupee risk ÷ Entry-to-stop distance
Suppose an illustrative account is ₹50,000 and the trader chooses a ₹250 risk budget. That is 0.5% of the account, used here as an example rather than a recommendation for everyone.
In the SBI example, the risk per share is ₹4:
₹250 ÷ ₹4 = 62.5 shares
Round down to 62 shares before considering costs. If ₹30 of the budget is reserved for estimated charges and slippage, ₹220 remains for price risk, allowing 55 shares.
At ₹813 each, 55 shares cost ₹44,715 before charges for a fully funded purchase.
Actual loss can exceed the budget if execution is worse than expected. Keep position size within available funds and avoid excessive borrowing.
Also set a daily loss limit across all positions. Three bank stocks bought on similar breakouts may all reverse together; each trade is not an independent risk.
Backtesting the Strategy
Start with one liquid stock and enough historical intraday data to cover different types of sessions.
Write down every rule before reviewing outcomes: opening window, chart timeframe, retest definition, entry trigger, cancellation conditions, stop allowance, target and time exit.
Review a meaningful sample—for example, 100 or more qualifying setups across several months. This is a starting point for study, not proof of reliability.
Record:
- Wins, losses and time-based exits.
- Actual assumed entry and exit prices.
- Average reward relative to initial risk.
- Average winning and losing trade after costs.
- Consecutive losses and maximum drawdown.
- Results on trending, sideways, gap-opening and event days.
Drawdown is the decline from an account-value peak to a later low. It shows how much a losing stretch could affect the account.
Be careful with historical candles. If one candle crosses both the stop and target, its high and low do not tell you which came first. Use finer data or a conservative assumption.
Do not assume an entry at a breakout candle’s closing price if your decision requires seeing that completed close first. Model the next available execution.
Finally, check the unchanged rules on a separate period and paper trade them in real time. Include brokerage, applicable taxes and fees, spread and slippage before drawing conclusions.
Simple Trading Checklist
Before considering a trade, ask:
- Has the full opening window finished?
- Are the range high and low fixed using candle wicks?
- Has a completed candle closed outside the range?
- Did a qualifying retest occur within the allowed time?
- Is the next-candle entry trigger still valid?
- Is there enough room before support or resistance for 2R?
- Are the stop, quantity and maximum rupee risk defined?
- Are liquidity and event conditions acceptable?
- Is the entry before the cutoff and within the daily loss limit?
If a required condition is missing, it is not this setup.
Advantages and Limitations
| Aspect | Advantage | Limitation |
|---|---|---|
| Preparation | Two clear opening levels | The chosen time window changes signals |
| Indicators | Can be studied using price alone | Simple tools still require careful execution |
| Retest entry | Offers a visible turning point for the stop | Strong moves may never retest |
| Risk planning | Entry and stop can be defined beforehand | Slippage can increase the actual loss |
| Market conditions | Designed to study directional expansion | Sideways sessions can produce false breaks |
Who Is This Strategy Suitable For?
Beginners can use it to practise reading candles, marking levels and calculating risk. Paper trading is a sensible place to begin.
Live execution is more suited to intraday traders who can monitor the opening session and act on a prepared plan. It may be inconvenient for someone whose job prevents regular chart checks.
Swing and positional traders need a different holding-period plan. This lesson’s rules require closing the trade within the same day.
Experienced traders may use other opening windows or filters, but those changes need their own testing.
Key Takeaway
The opening range gives you two useful reference points for the morning. A breakout tells you where price is trying to go; the retest helps you assess whether that move is holding.
The trade still needs enough room, a logical stop and a position size you can manage. Some days the most disciplined decision will be to take no trade.
Practise the same rules, record the results honestly and judge the method over time. A clean setup deserves attention, but it never removes uncertainty.
5 Frequently Asked Questions
Q1. Is a 15-minute opening range better than a 5-minute range?
There is no universal winner. A shorter range allows earlier signals but may react to more opening noise. A longer range delays the decision and can produce a wider stop. Test each separately.
Q2. Is the pre-open session part of the opening range?
Not in this lesson. The range starts with normal trading at 9:15 AM IST on a regular NSE equity session.
Q3. What if price breaks out but never retests?
Under this version, skip the trade. Entering immediately on a breakout is a separate variation with different rules and results.
Q4. Can ORB be used on Nifty or Bank Nifty?
Their price charts can be used to study opening ranges. Trading through futures, options or an ETF requires separate execution and risk calculations. The index itself is not bought or sold directly.
Q5. What is the success rate of the ORB strategy?
There is no fixed success rate. It depends on the instrument, opening window, entry and exit rules, market conditions and costs. A win percentage alone cannot establish profitability.
Trading Strategy 101 – Lesson 3: VWAP Intraday Trading Strategy
Strategy #2 – 20 EMA and 50 EMA Trend Trading Strategy for Beginners
Strategy #1 – Support and Resistance Breakout Strategy for Beginners
Stock Market 101 – Lesson 34: How to Choose a Mutual Fund
Stock Market 101 – Lesson 28: Market Cycles Explained
Educational Disclaimer
This article is for educational and informational purposes only and should not be considered investment or trading advice. Stock-market trading involves risk, and past performance or historical examples do not guarantee future results.