
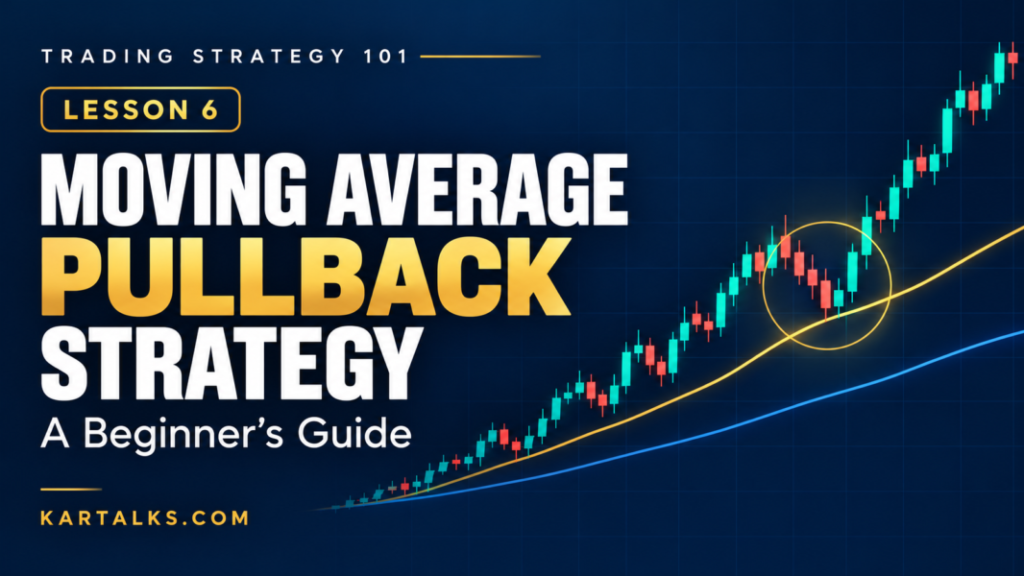
Trading Strategy 101 – Lesson 6: Moving Average Pullback Strategy for Beginners
Introduction
You spot a stock climbing steadily. By the time you decide to buy, it has already formed a large green candle. You enter, the price dips, and suddenly a promising trade feels uncomfortable.
The direction may have been right. The entry still left very little room for normal price movement.
The moving average pullback strategy gives traders a reason to wait. Instead of buying after every sharp rise, they watch for a pause or a return towards a moving average, then look for evidence that the trend is resuming.
It can suit intraday traders who are comfortable letting some moves go. Swing traders can use the same broad idea, though their chart settings, holding periods and risks need separate attention.
The important question is not, “Has price touched the line?” It is, “Does the trend still hold, and is there a sensible trade here?”
What Is the Moving Average Pullback Strategy?
A moving average smooths price data to help show the direction of a trend. A simple moving average, or SMA, gives equal weight to the observations in its selected window. An exponential moving average, or EMA, gives greater weight to recent observations.
This lesson uses a 20 EMA for the pullback and a 50 EMA as a trend filter, both calculated from closing prices.
The basic idea is to study temporary moves against an established trend. In an uptrend, that means a decline towards the faster average. In a downtrend, it means a rally towards it.
Traders use EMAs to assess trend direction and possible support or resistance areas. However, these averages follow price and cannot identify exact market tops or bottoms.
Fidelity’s explanation of exponential moving averages
A moving average does not create a floor under a stock. It can be crossed, ignored or broken.
Here, the averages provide context. Price behaviour supplies the confirmation.
Zerodha Varsity’s guide to moving averages
Quick Strategy Snapshot
| Factor | Details |
|---|---|
| Trading style | Intraday version; swing adaptations require separate testing |
| Suitable market | Trending markets with orderly pullbacks |
| Suggested timeframe | 15-minute setup chart; 1-hour chart for context |
| Indicators/tools | 20 EMA, 50 EMA, candlesticks, marked price levels |
| Difficulty | Beginner-friendly concept; execution requires practice |
| Risk level | Meaningful risk from trend reversals, false signals and poor execution |
How the Strategy Works
1. Establish the direction
For a bullish setup, look for higher swing highs and higher swing lows. The 20 EMA should be above the 50 EMA.
For a bearish setup, look for lower highs and lower lows, with the 20 EMA below the 50 EMA.
Both averages should be moving in the intended direction. Flat, tangled lines usually make this particular method harder to apply.
A crossover alone is not the entry. The focus is on what price does during a later pullback.
2. Let price return towards the average
A rising stock does not have to move upwards in every candle. Some traders book profits, others wait, and price may drift back.
That return can bring price closer to a logical stop-loss location. It does not necessarily make the trade safer: the decline may be the beginning of a reversal.
Watch whether the earlier swing structure remains intact.
3. Wait for evidence of a response
A touch of the 20 EMA only tells you where price is.
A completed candle closing back above the average and above the previous candle’s high gives a more specific bullish event to assess. The bearish version reverses those conditions.
Even then, check the distance to the stop and the next opposing price level. A recognisable pattern can still be a poor trade.
Chart Setup
Use a liquid NSE-listed stock for your initial study.
Set up:
- A 15-minute candlestick chart.
- A 20-period EMA, using closing prices.
- A 50-period EMA, also using closing prices.
- A 1-hour chart with the same averages for context.
- Horizontal marks at recent swing levels and the previous day’s high and low.
Keep the EMA offset at zero. Load enough historical bars for the averages to settle, and retain earlier sessions rather than resetting the calculation each morning.
“20 periods” means 20 chart bars as the EMA’s length setting. On a 15-minute chart, it does not mean 20 days. The EMA also carries progressively smaller contributions from older data through its calculation.
For consistent swing identification, one possible rule is a swing high above the highs of the two candles on either side, and a swing low below their lows. Such a swing becomes confirmed only after the two following candles close.
Use that definition consistently when testing. Do not identify a turning point with future candles and then pretend it was known earlier.
Entry Conditions
The following sample rules make the idea specific enough to study. They are not universal settings.
For this version, allow new entries from 9:45 a.m. to before 2:00 p.m. IST, with a maximum of one filled trade per stock per day. These are chosen study rules, not exchange requirements.
Bullish or long setup
- Trend structure: The last two confirmed 15-minute swing highs and swing lows are rising.
- EMA alignment: The 20 EMA is above the 50 EMA. Each average is higher than its own value three completed candles earlier.
- Higher-timeframe filter: On the latest completed 1-hour candle, price closes above the 20 EMA, and the 20 EMA is above the 50 EMA.
- Pullback: After at least three consecutive closes above the 20 EMA, price returns to it. A touch qualifies when a completed candle’s low is at or below its closing 20 EMA value and its high is at or above it.
- Structure remains intact: From the start of the pullback through confirmation, no candle closes below the 50 EMA or the latest confirmed higher swing low.
- Confirmation: The touch candle, or one of the next two candles, closes above its own open, above the previous candle’s high, and above the 20 EMA.
- Entry trigger: Consider entry only when the next candle trades above the confirmation candle’s high.
At confirmation, the trend and EMA filters must still hold. Require room for at least 2R before the nearest marked resistance, using the intended entry and structural stop.
Here, R means the planned price risk per share.
Cancel an unfilled setup if the next candle does not trigger or if the planned stop is breached first. If price gaps beyond the trigger, reassess the actual entry price and skip if the risk-reward condition fails.
Bearish or short setup
Reverse the conditions:
- Confirm lower swing highs and lower swing lows.
- Require the 20 EMA below the 50 EMA, with both below their values three completed candles earlier.
- Require the latest completed 1-hour close below the 20 EMA, with the 20 EMA below the 50 EMA.
- After at least three closes below the 20 EMA, wait for a rally that touches it.
- Reject the setup if a pullback candle closes above the 50 EMA or the latest confirmed lower swing high.
- Require the touch candle or one of the next two candles to close below its own open, the previous candle’s low, and the 20 EMA.
- Consider entry below that confirmation candle’s low during the next candle, with at least 2R available before support.
Apply the same cancellation rules.
An ordinary cash-market intraday short must be covered that day. Check your broker’s stock eligibility and square-off cutoff; do not assume it can be carried overnight.
Zerodha Varsity’s guide to short selling
Confirmation Before Entry
What makes a pullback worth studying?
The candle close matters. A candle can look strong halfway through its formation and finish weak. Use completed candles for the setup conditions.
The location matters. A pullback near previously marked support may provide additional context. Avoid drawing a convenient support line after seeing the bounce.
The higher timeframe matters. A small recovery on the setup chart may still be part of a larger decline. Use only the completed hourly candle available at the decision time.
Volume can be an optional check. Increased activity as price resumes its trend may be worth recording, but it does not prove continuation. If you require a volume threshold, define it before testing.
Do not keep adding indicators until the chart agrees with the trade you want.
how to identify support and resistance
Stop-Loss Placement
For a long trade, place the planned stop below the lowest price of the pullback, including the confirmation candle, with a predefined buffer.
For a short trade, place it above the pullback’s highest price.
For this framework, measure the pullback from the first candle that closes against the preceding move until the confirmation candle. For a bullish setup, that starting candle closes below the preceding close; reverse this for a bearish setup.
The reason for the stop is straightforward: the trade assumes the pullback is ending. A fresh move beyond its extreme weakens that assumption.
Choose the buffer before entry, taking account of the stock’s tick size, spread and normal movement. Record the rule so it can be repeated.
Do not put the stop exactly on the EMA merely because the line is easy to see. It moves as new prices arrive.
If the structural stop is too wide, reduce quantity or skip. A stop order also cannot guarantee an exact exit price during a fast move.
Target and Exit Strategy
Define the risk before entering, then select an exit method.
For a simple first test, use:
- The original structural stop.
- A fixed 2R target.
- A time exit at 3:00 p.m. IST, or earlier if required by the broker.
- No widening of the stop.
These are sample parameters, not a claim about the best exit time or reward ratio.
Other methods include taking profit before a marked resistance or support level, or trailing behind newly confirmed price swings. An EMA-based exit can also be tested, such as leaving a long trade after a completed close below the 20 EMA.
Keep those alternatives separate in your records. A close-based exit can be slower than a protective stop, and partial profit booking changes the trade’s total reward.
Choose the method before the trade, not after watching the profit fluctuate.
Risk-Reward Example
Hypothetical example for education only:
- Entry: ₹500
- Stop-loss: ₹494
- Risk: ₹6 per share
- Target at 1:2 risk-reward: ₹512
- Potential reward: ₹12 per share
For 20 shares, the planned price loss is ₹120 and the target price gain is ₹240, before charges and slippage.
The target may never be reached. A planned 2R reward does not establish a profitable strategy.
Practical Indian Market Example
Consider a hypothetical SBI intraday chart. These prices are invented to explain the method, not current market levels or a recommendation.
Setup
SBI has rising confirmed swing highs and lows on the 15-minute chart. Its latest confirmed higher swing low is ₹792.
The 20 EMA is above the 50 EMA, and both are higher than three candles earlier. The completed hourly chart also meets the bullish filter.
After several closes above the 20 EMA, price pulls back.
Confirmation
At the touch candle’s close, the 20 EMA is ₹800 and the 50 EMA is ₹793. The candle opens at ₹800, trades down to ₹798, reaches ₹803, and closes at ₹802.50.
The previous candle’s high was ₹802. The new close is above that high, above its own open and above the 20 EMA.
The pullback’s lowest price is ₹798. No pullback candle has closed below the 50 EMA or the higher swing low.
Entry
During the next candle, price trades above ₹803. Assume an actual entry at ₹804.
The fill matters. Risk is calculated from ₹804, not from the earlier confirmation close.
Stop-loss
Assume a buffer of ₹1 for this illustration, giving a stop at ₹797.
Price risk = ₹804 − ₹797 = ₹7 per share.
The ₹1 buffer is an example, not a setting for every stock.
Target or exit
A 2R target is ₹818. Suppose the nearest marked resistance is ₹822, leaving sufficient room.
If resistance were instead at ₹810, there would be only ₹6 of room against ₹7 of risk. The trade would be skipped.
If entered, the position exits at the stop, target or planned time exit—whichever comes first. A failed bounce remains entirely possible.
When This Strategy Works Best
The conditions most suited to this approach are:
- A clear directional trend.
- A pullback that preserves the recent swing structure.
- Averages moving in the same direction rather than repeatedly crossing.
- Enough room before the next opposing level.
- Sufficient liquidity for reasonably consistent execution.
An orderly decline during an uptrend is easier to assess than a sudden, wide-range sell-off.
These conditions fit the method’s logic. Whether they produce a useful advantage after costs needs evidence from testing.
When to Avoid This Strategy
Avoid or skip the setup when:
- The averages are flat: Price keeps crossing them without follow-through.
- The trend structure breaks: A lower low is being dismissed as “just another dip.”
- Price has already run away: The entry is now far from the pullback and stop.
- The confirmation candle is unusually large: Waiting for confirmation has left poor risk-reward.
- Liquidity is weak: Wide spreads make the chart price difficult to trade.
- Major news is due: Results or policy announcements may abruptly change price behaviour.
- A nearby level blocks the target: There is insufficient room for the planned reward.
A skipped trade is a valid result of following the rules.
False Signals and Strategy Limitations
The difficult part is that a reversal often begins by looking like an ordinary pullback.
A stock can bounce from its average, trigger an entry, and then fall through the pullback low. The earlier trend may have ended.
Moving averages also use past prices, so their direction can remain positive while current buying weakens. Faster averages react sooner but can change direction more often.
The 20 EMA and 50 EMA are related calculations from the same price series. Their agreement does not amount to two independent guarantees.
Expect losing trades. Evaluate many outcomes, including costs and different market conditions, rather than declaring success after a few neat chart examples.
Common Mistakes Beginners Make
- Buying immediately when price touches the EMA.
- Using the setup in a sideways market.
- Confusing a fresh crossover with a confirmed pullback.
- Changing the average from 20 to 21 or 30 after every loss.
- Entering before the confirmation candle closes.
- Moving the stop farther away once the trade goes against them.
- Using a larger quantity because the setup “looks obvious.”
- Turning an intraday loss into an unplanned delivery holding.
Another mistake is treating a stock setup as an automatic options trade. Option prices also depend on factors such as time decay and implied volatility. The share-based calculations here do not describe options risk.
Position Sizing and Risk Management
Decide the maximum acceptable loss first. Then calculate quantity.
Quantity = rupee price-risk budget ÷ risk per share
Suppose a hypothetical ₹50,000 account has a ₹250 total trade-risk budget. This is 0.5% of the account, shown only for arithmetic—not as a recommended risk level.
Reserve ₹40 for estimated charges and slippage. That leaves ₹210 for price risk.
With ₹7 risk per share:
₹210 ÷ ₹7 = 30 shares
At ₹804, a fully funded purchase costs ₹24,120.
If available funds are insufficient, reduce the quantity. Do not increase borrowing just to reach the calculated size.
Costs and slippage can exceed the estimate, so ₹250 is not a guaranteed maximum loss. Also set a daily loss limit and consider combined exposure: several banking stocks may move against you together.
Backtesting the Strategy
Begin with one instrument, one timeframe and written rules.
Specify the EMA settings, swing definition, pullback start, touch condition, confirmation window, entry trigger, stop buffer and exit method.
Then review a meaningful historical sample. Around 100 qualifying setups across different conditions can be a starting exercise, but no fixed number proves reliability.
Record:
- Entry, stop, target and actual exit.
- Wins, losses and time exits.
- Average winning reward-to-risk and average losing risk.
- Net result in R after estimated costs.
- Longest losing streak.
- Maximum drawdown—the largest fall from a running account peak.
- Conditions associated with poor results.
Use only information available at the time. Confirmed swings and completed hourly candles must not appear earlier in the test than they did in real trading.
If one candle touches both stop and target, do not automatically count the target first. Use finer data or a conservative assumption.
Keep some data aside to test the finished rules, then paper trade before considering real money.
Simple Trading Checklist
- Is there a clear sequence of rising or falling swings?
- Are the EMAs aligned and moving in the intended direction?
- Does the completed hourly chart meet the filter?
- Has price made a qualifying pullback to the 20 EMA?
- Has the required confirmation candle closed?
- Is the next-candle entry trigger still valid?
- Is the stop beyond the full pullback extreme?
- Is at least 2R available before the opposing level?
- Does quantity fit the risk budget and available funds?
- Are the time limits and event checks satisfied?
If an essential condition is missing, the setup does not qualify.
Advantages and Limitations
| Advantage | Limitation |
|---|---|
| Encourages waiting instead of chasing | Strong moves may never offer a pullback |
| Uses widely available chart tools | Accessible tools do not guarantee an edge |
| Links risk to visible price structure | Logical stops may be too wide to trade |
| Provides a repeatable study framework | Some chart definitions still require careful consistency |
| Can be adapted to different holding periods | Each adaptation needs separate testing |
Who Is This Strategy Suitable For?
Beginners can use it to practise recognising trends, pullbacks and failed setups. Paper trading helps separate understanding the chart from managing real-money pressure.
Intraday traders need time to monitor confirmations and manage exits. This version may not suit someone unable to check the market during the session.
Swing traders can study a daily-chart version, with separate rules for overnight gaps and holding periods.
Positional traders need a longer-term framework. Experienced traders may refine the filters, but complexity alone does not improve results.
Key Takeaway
The moving average pullback strategy is about waiting for a possible entry within an established trend. The average gives you an area to watch; price confirmation and risk assessment determine whether there is a setup worth considering.
A touch is not a promise of a bounce. Keep the stop tied to structure, the quantity tied to your risk budget, and the exit tied to a plan.
Consistency comes from following and reviewing the process across many trades, including the ones you choose to skip.
5 Frequently Asked Questions
Q1. Which moving average is best for pullbacks?
There is no universally best choice. This lesson uses a 20 EMA with a 50 EMA filter as a starting framework to test.
Q2. Can I use an SMA instead of an EMA?
Yes, but it changes the signals. An SMA responds differently, so test the revised rules rather than assuming the results will be the same.
Q3. Should I buy as soon as price touches the average?
No. In this framework, a touch only creates a watchlist condition. A completed confirmation candle and valid entry trigger are still required.
Q4. Can I apply this to Nifty 50 or Bank Nifty?
You can study their charts, but the spot indices are not directly tradable. Any ETF or derivative used for execution needs its own sizing and risk assessment.
Q5. What if price never pulls back?
Let that move go. Chasing it creates a different setup with a different stop distance and reward-to-risk profile.
Further Reading
Trading Strategy 101 – Lesson 5: RSI + Price Action Trading Strategy
Trading Strategy 101 – Lesson 4: Opening Range Breakout (ORB) Strategy
Trading Strategy 101 – Lesson 3: VWAP Intraday Trading Strategy
Strategy #2 – 20 EMA and 50 EMA Trend Trading Strategy for Beginners
Strategy #1 – Support and Resistance Breakout Strategy for Beginners
Stock Market 101 – Lesson 26: Management Discussion (MD&A): How to Read Promoter Confidence
Article Information
Author: Kartalks Education Desk
Reviewed by: Kartalks Editorial Team
Content Type: Stock market education, moving average pullback trading strategy, trend-following techniques, 20 EMA and 50 EMA analysis, entry and exit planning, stop-loss placement, risk management, false signal awareness, and trader education
Sources: SEBI investor education material, NSE/BSE educational resources, technical analysis references, stock exchange learning resources, and official public sources
Last Updated: October 17, 2026
Disclaimer
This article is for educational and informational purposes only and should not be considered investment or trading advice. Stock-market trading involves risk, and actual losses may exceed planned losses. Past performance and hypothetical examples do not guarantee future results. Conduct your own research and consider consulting a SEBI-registered investment adviser before making financial decisions.
You are doing a really great work by covering all aspects of this type of trade.
Very useful for not just beginners but every trader.
Thank you.
Thank you, Srinivas! We’re glad you find our trading strategies useful. Your continued support and encouragement mean a lot to us!