📈 Indian Markets Weekly View (June 15–June 19, 2026): Cautiously Bullish Sentiment, but 24,000 Still Matters
Indian markets enter the new week with a much better tone than they had a week ago. Friday’s rally was the strongest in about two months, helped by hopes of a U.S.-Iran peace deal, a sharp fall in crude oil, and better sentiment toward financials. Still, this is not yet a clean breakout market. The key question for this week is whether the Nifty can hold above the 20-day EMA area near 23,500 and then push through 23,800–24,000.
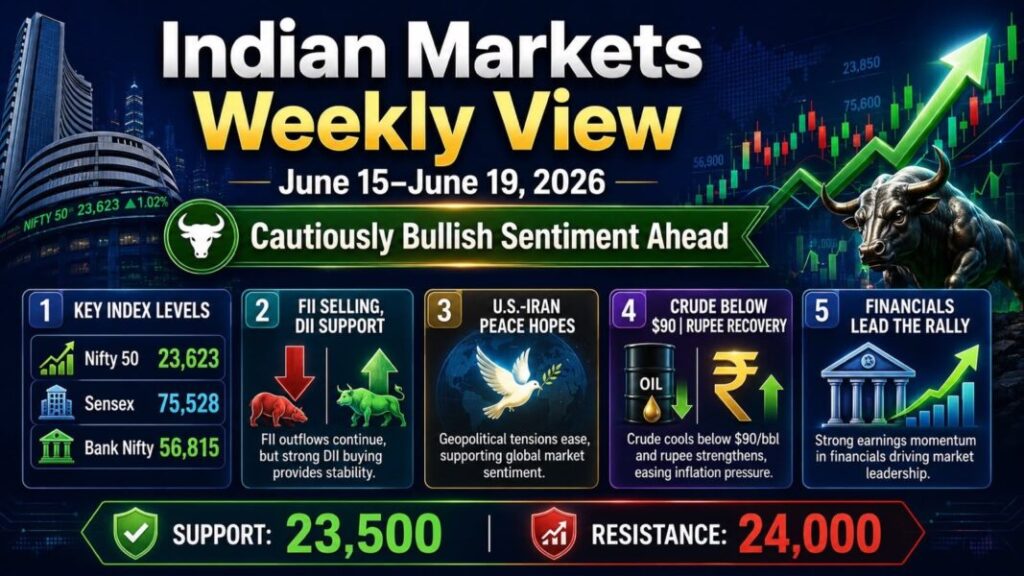
🧭 Indian Markets Weekly View: Quick Market Snapshot
| Index / Indicator | Latest reading | Weekly move | What it suggests |
|---|---|---|---|
| Nifty 50 | 23,622.90 | +1.1% | Short-term tone improved |
| Sensex | 75,527.95 | +1.7% | Strong rebound after two weak weeks |
| Bank Nifty | 56,814.80 | +4.25% | Clear weekly outperformer |
| India VIX | 14.71 | -5.73% | Fear cooled, but not gone |
| Rupee | 95.11/USD | +0.7% on day | Relief from lower oil |
| Brent crude | $86.71/bbl | Down sharply | Positive for India if it sustains |
The table above combines Reuters, Moneycontrol, Upstox and Reuters commodities/currency coverage available after the June 12 close. Bank Nifty’s spot reference is from Upstox’s delayed 16:00 IST option-chain snapshot, while the weekly gain and VIX reading are from Moneycontrol’s June 12 technical wrap.
Fast reading
- The market mood has clearly improved after Friday’s rally.
- Financials led the rebound, while IT remained weak.
- Lower crude is the biggest short-term positive for India right now.
- The next big technical test is still 23,800–24,000 on Nifty.
🔑 Current Key Levels, Support and Resistance
Nifty 50 levels
| Level type | Zone |
|---|---|
| Immediate support | 23,500 |
| Strong support | 23,400–23,300 |
| Immediate resistance | 23,800 |
| Major resistance | 24,000–24,100 |
Moneycontrol’s latest technical view says the Nifty has turned stronger after reclaiming the 20-day EMA near 23,500. If it sustains above that zone and the U.S.-Iran deal narrative holds, the index can attempt 23,800 and then 24,100. If it slips back below the 20-day EMA, consolidation may resume, with support in the 23,400–23,300 band.
Bank Nifty levels
| Level type | Zone |
|---|---|
| Immediate support | 56,400–56,300 |
| Immediate resistance | 57,200–57,300 |
| Higher upside zone | 57,700–58,100 |
Bank Nifty has become the strongest pocket in the market. Moneycontrol says it surged 4.25% for the week, moved above key moving averages, and is now close to the April swing high. The immediate support is seen at 56,400–56,300, while a sustained move above 57,200–57,300 can open 57,700 and 58,100.
Sensex levels
| Level type | Zone |
|---|---|
| Immediate support | 75,000–74,800 |
| Lower support | 74,400 |
| Immediate resistance | 76,000 |
| Major resistance | 76,700 |
Sensex-specific levels are best read as an inference from the Nifty structure and Friday’s close. With Sensex at 75,527.95 and Nifty facing resistance at 23,800–24,100, the practical near-term map for Sensex is support near 75,000–74,800 and resistance near 76,000, then 76,700. This is an analytical inference, not an exchange-issued level.
📉 Weekly View and Range Forecast
The market has shifted from a defensive structure to a cautiously bullish one, but only for now. Friday’s rally formed a strong bullish weekly candle on Nifty and a much stronger one on Bank Nifty. Even so, the market still needs confirmation above 23,800–24,000 on Nifty before calling this a full trend reversal.
| Index | Weekly range forecast |
|---|---|
| Nifty 50 | 23,300 – 24,100 |
| Sensex | 74,400 – 76,700 |
| Bank Nifty | 56,300 – 58,100 |
This range forecast is based on the latest support-resistance structure from Moneycontrol and Friday’s closing levels from Reuters and Upstox. It is a practical working range, not an official exchange forecast.
💼 FII and DII Overview in Last Week
FII selling did not stop last week, but DII support stayed very strong.
| Date | FII net (₹ cr) | DII net (₹ cr) |
|---|---|---|
| 8 Jun 2026 | -5,555.67 | +5,165.24 |
| 9 Jun 2026 | -4,566.03 | +6,159.48 |
| 10 Jun 2026 | -2,124.98 | +3,123.95 |
| 11 Jun 2026 | -1,987.09 | +4,224.51 |
| 12 Jun 2026 | -1,082.18 | +5,341.29 |
Adding the five daily cash-market readings gives net FII selling of about ₹15,315.95 crore and net DII buying of about ₹24,014.47 crore for the week. That tells you the rally was supported more by domestic money and sentiment relief than by a real return of foreign conviction.
What this flow picture means
- DIIs are still protecting the market on dips.
- FIIs are still selling, just at a slower pace by the end of the week.
- The next leg higher becomes more durable only if foreign selling fades further.
🌍U.S.-Iran War Updates and Impact on Stock Markets
This remains the biggest global trigger for Indian equities. Reuters reported that the U.S. and Iran were very close to a deal and that a signing could happen within days, with reopening of the Strait of Hormuz central to the framework. Another Reuters report said Pakistan’s prime minister expected the peace-deal signing within 24 hours.
For Indian markets, the chain reaction is simple:
peace progress → lower crude → stronger rupee → better FII sentiment → stronger equities. That is exactly what played out on June 12, when Brent dropped sharply and Indian equities had their best day in two months.
Market impact for this week
- If Hormuz reopening gets confirmed, India benefits immediately through oil.
- If talks stall again, crude can jump back fast.
- That makes this week a headline-driven week, even after Friday’s rally.
🏛️SEBI New Updates
Recent official SEBI items include:
- Jun 11, 2026: Extension of timelines for compliance with certain provisions of the January 2, 2026 circular.
- Jun 3, 2026: Master Circular for Alternative Investment Funds.
- May 29, 2026: Modified norms for nomination in demat accounts and mutual fund folios.
- May 19, 2026: Revision of Monthly Cumulative Report format.
These are not one-day Nifty triggers, but they matter for compliance ease, market infrastructure and investor servicing. For a weekly market article, they add useful regulatory context without drifting into speculative or unsafe content.
🧮Open Interest and Put-Call Ratio
The derivatives setup has improved meaningfully, but it is not euphoric.
| Measure | Latest read |
|---|---|
| Nifty PCR | ~1.75 |
| Bank Nifty PCR | ~1.09 |
| Nifty max hurdle | 24,000 Call OI zone |
| Nifty support OI zone | 23,500–23,300 |
| Bank Nifty support | 56,400–56,300 |
| Bank Nifty resistance | 57,200–57,300 |
Upstox’s live PCR pages show Nifty PCR around 1.75 and Bank Nifty PCR around 1.09, while Moneycontrol says maximum Nifty call open interest is concentrated near 24,000 and put support lies in the 23,500–23,300 area. That combination signals improving sentiment, but also says the market still has a visible ceiling overhead.
🚀 Indian Markets Weekly View: IPOs Existing and Upcoming Updates
The IPO calendar for the week remains dominated by SME names.
| IPO | Window / Listing | Price band |
|---|---|---|
| Susan Electricals India | 11–15 Jun | ₹120–₹127 |
| Horizon Reclaim (India) | 12–16 Jun | ₹98–₹103 |
| Liotech Industries | 17–19 Jun | ₹321 |
| Leapfrog Engineering Services | 17–19 Jun | ₹21–₹23 |
| Diksha Polymers | 17–19 Jun | ₹112 |
| Clay Craft India | 17–19 Jun | ₹193–₹203 |
Zerodha’s IPO tracker shows Susan and Horizon as the live issues going into the week, while Liotech, Leapfrog, Diksha and Clay Craft line up in the June 17–19 window.
IPO takeaway
The primary market is active, but still selective. This is not a blanket risk-on IPO market. Better-priced issues and clearer businesses are likely to continue getting better response than weaker stories. That inference is consistent with the broader “stock-pickers’ market” tone visible in Indian equities right now.
🛢️Commodity Market and Currency Update
Brent crude settled at $86.71and WTI at $84.21on June 12, both at their lowest levels in months, as hopes of a U.S.-Iran deal intensified. That is a major positive for India. On the currency side, Reuters said the rupee closed at 95.11 per dollar, gaining about 0.7% on the day after the oil slump.
Gold tells a different story. Reuters said gold fell to around $4,188/oz on Friday after a sharp correction from its earlier highs, showing that the market was rotating away from fear assets as oil cooled and peace hopes improved.
Commodity and currency read
- Crude below $90 is supportive for Indian equities.
- Rupee at 95.11 is still weak in absolute terms, but the short-term direction improved.
- Gold falling suggests immediate panic has reduced, even if uncertainty has not disappeared.
🏆Last Week’s Better Performers
Last week’s leadership was clear.
Two sectors that looked stronger
- Financials, which led the weekly gains after RBI’s overseas borrowing easing for lenders.
- Lower-crude beneficiaries such as airlines, tyre, paint and cement makers, which benefited from the oil collapse.
Two stocks that stood out
- Kotak Mahindra Bank: about +6.9% for the week.
- ICICI Bank: about +6.2% for the week.
HDFC Bank also gained about 3.4%, but Kotak and ICICI were the clearest weekly outperformers among the large financials named by Reuters.
💡 Indian Markets Weekly View: Short-Term and Long-Term Investment View
Short-term view
This is now a buy-on-dips-above-23,500 market, not a chase-every-gap market. If Nifty holds above 23,500 and then clears 23,800–24,000, momentum can extend. If it slips back below 23,500, the market can quickly return to consolidation around 23,400–23,300.
Long-term view
For long-term investors, the tone has improved, but staggered buying still looks better than aggressive lump-sum chasing. Financials and quality domestic cyclicals look more attractive than weak IT momentum right now. That is an inference from the week’s sector leadership, lower crude, and still-ongoing FII selling.
❓5 FAQs
1. What is the sentiment for June 15–June 19, 2026?
The sentiment is cautiously bullish because markets rebounded sharply on lower crude and peace hopes, but the breakout is not confirmed until Nifty clears 23,800–24,000.
2. What are the most important Nifty levels this week?
The key support zone is 23,500–23,300. The main upside hurdles are 23,800 and then 24,000–24,100.
3. Why is the U.S.-Iran issue still so important for Indian markets?
Because it directly affects Hormuz traffic, global oil prices, India’s rupee, inflation risk and foreign investor sentiment.
4. Which areas look relatively stronger now?
Financials and lower-crude beneficiaries are stronger. Among stocks, Kotak Mahindra Bank and ICICI Bank were among the clearest weekly winners.
5. Should investors buy aggressively this week?
A more balanced approach is better. This looks like a selective, level-based market rather than a fully confirmed broad bull run.
Further Reading
Indian Markets Weekly View (June 8–June 12, 2026): Cautious Sentiment
Gold vs Silver vs Gold ETF: Where Should Indian Investors Look in 2026?
IPO Investing Guide: Complete Beginner’s Guide to Check IPO Before Applying
Stock Market 101 – Lesson 34: How to Choose a Mutual Fund
Disclaimer
This article is for educational and informational purposes only. It is not investment advice or a recommendation to buy or sell any security. Stock markets remain sensitive to crude oil, currency moves, FII flows, policy changes and geopolitical developments. Please consult a SEBI-registered financial advisor before making investment decisions.
Article Information
Author: Kartalks Research Desk
Reviewed by: Kartalks Editorial Team
Content Type: Weekly Indian stock market outlook, index levels, sector performance, FII/DII activity, IPO updates, commodity trends, currency movement, and investor education
Sources: NSE, BSE, SEBI, weekly market data, FII/DII activity, sector performance, IPO filings, commodity market data, currency market updates, company filings, and official public sources
Last Updated: June 14, 2026