
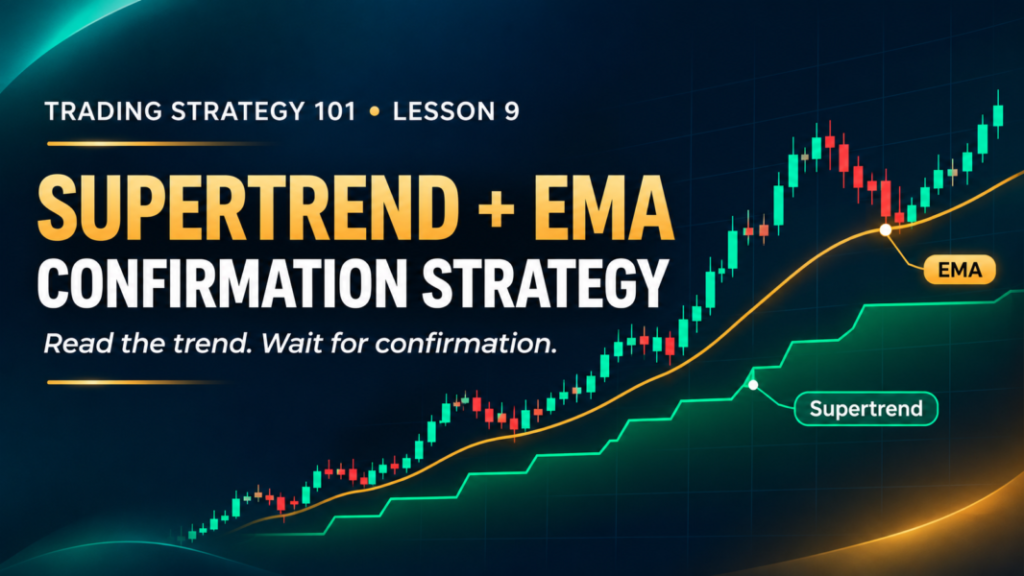
Trading Strategy 101 – Lesson 9: Supertrend + EMA Confirmation Strategy for Beginners
A stock can rise for several days and still have a weak day in between. That pause often leaves a beginner with a difficult question: is the trend ending, or is price simply taking a breather?
The Supertrend + EMA confirmation strategy gives traders a structured way to examine that question. The EMA helps show the broader direction of price. Supertrend adds a second view of the trend that adjusts to recent price movement. A trader then looks for price action that supports both indicators before considering an entry.
This approach may appeal to swing traders who prefer to follow an existing trend rather than guess where a reversal will begin. It can also be studied on intraday charts. Still, two indicators showing the same direction do not make a trade safe. The position of nearby support or resistance, the entry price and the possible loss matter just as much as the signal.
What Is the Supertrend + EMA Confirmation Strategy?
An exponential moving average, or EMA, is an average of recent prices that gives more weight to newer prices. In this lesson, the 20-period EMA provides a simple direction check: is price generally holding above it or below it, and is the line rising or falling?
TradingView: Exponential Moving Average
Supertrend is a line plotted on the price chart. It uses Average True Range (ATR), a measure of recent price movement, along with a multiplier. Depending on the indicator’s direction, the line appears below or above price. It can help a trader identify a possible trend change and plan an exit, but it can also give false signals.
The basic idea is to trade when both tools agree and the chart offers a sensible setup. For example, a stock above a rising EMA with a bullish Supertrend may be in an uptrend. Rather than buying simply because both lines look bullish, a trader can wait for a small pullback and a candle showing that buyers have returned.
Both tools are calculated from price that has already traded. Confirmation can help filter some weak setups, but it can also mean entering later. There is always a trade-off.
TradingView: Supertrend indicator
Quick Strategy Snapshot
| Factor | Details |
|---|---|
| Trading style | Swing trading in this lesson; can be tested for intraday trading |
| Suitable market | A clear trend with manageable pullbacks |
| Suggested timeframe | Daily chart for the setup; weekly chart for broader context |
| Indicators/tools | 20-period EMA, Supertrend (ATR period 10, multiplier 3), volume and support/resistance |
| Difficulty | Beginner to intermediate |
| Risk level | Meaningful; trends can reverse and overnight gaps can exceed a planned stop |
How the Strategy Works
Picture a stock that has been making higher highs and higher lows. Its 20-day EMA is rising, and Supertrend is below price. Those observations suggest that the recent direction has been upward. They do not tell you that today is a good day to buy.
Price may be too far above the EMA. It may also be approaching an old resistance level where previous rallies stopped. Entering there could leave little room for a target while requiring a distant stop-loss.
A more measured approach is to wait for a pullback. If price moves closer to the EMA without breaking the broader upward structure, then forms a candle that shows renewed buying, the trader has a clearer place to plan an entry and stop. Supertrend should still agree with the direction.
The bearish version follows the same reasoning in reverse: a falling EMA, bearish Supertrend, a temporary rise towards the EMA and a subsequent sign that sellers have returned.
This is a trend-following strategy. It is designed to participate in a move that may continue, not to predict the exact top or bottom.
Chart Setup
For the examples in this lesson, open a daily candlestick chart of a liquid NSE-listed stock. Add:
- A 20-period EMA, calculated from closing prices.
- A Supertrend indicator set to ATR period 10 and multiplier 3.
- Volume bars beneath the chart.
These settings are a starting point for a consistent practice exercise, not the “best” settings for every stock. Supertrend’s ATR period and multiplier can be changed, which changes how sensitive its line is to price movement. Test any change instead of adjusting settings after seeing a losing trade.
Zoom out enough to see several weeks of candles. Mark the nearest clear support and resistance levels. Note whether the stock has been making higher highs and higher lows, lower highs and lower lows, or neither. A quick look at the weekly chart can help you avoid treating a small daily bounce as a major uptrend.
Beginners should prepare these levels before looking for an entry. Otherwise, it is easy to notice a bullish signal first and only later discover that resistance is very close.
Entry Conditions
The following rules describe one educational version of the strategy. They are specific enough to backtest, but they are not a recommendation to trade any particular stock.
Bullish or long setup
- On the daily chart, the 20-period EMA is rising. For a simple testable rule, its latest completed value should be above its value three completed candles earlier.
- Price is above the EMA, and Supertrend shows an uptrend with its line below price.
- Price pulls back towards the EMA for one or more candles without closing below the Supertrend line. The pullback should leave a visible low that can be used to assess risk.
- A completed confirmation candle closes above the high of the preceding pullback candle while remaining above the EMA. Supertrend must still show an uptrend at that close.
- A possible entry is above the confirmation candle’s high on a later candle. Recalculate the stop distance using the actual entry price. Skip the trade if price gaps too far above the trigger or nearby resistance leaves poor reward-to-risk.
Bearish or short setup
- The 20-period EMA is falling, with its latest completed value below its value three completed candles earlier.
- Price is below the EMA, and Supertrend shows a downtrend with its line above price.
- Price rises towards the EMA but does not close above the Supertrend line.
- A completed confirmation candle closes below the low of the preceding pullback candle while remaining below the EMA.
- A later move below the confirmation candle’s low is a possible short-entry trigger, provided nearby support and the planned stop leave enough room.
These are chart-study rules for the bearish side. Short positions involve different instruments, costs, margin requirements and broker rules. A beginner does not need to trade both directions.
Confirmation Before Entry
Why wait for a candle close? During a trading session, price can briefly cross an EMA or Supertrend line and finish back where it started. A completed daily candle gives a more stable observation for this version of the strategy. It cannot remove the risk of a reversal on the following day.
The shape of the pullback also matters. In a healthy-looking uptrend, a few smaller candles moving towards the EMA may be easier to assess than one very large bearish candle breaking several support levels. For a short setup, look at the opposite pattern.
Volume can add context. A strong move away from the pullback area with better participation may support the price-action reading. Low volume does not automatically invalidate a setup, but it gives less evidence that the renewed move has attracted interest.
Finally, check the levels already marked on the chart. If a long entry sits just below an earlier high, that level could limit the move. A favourable weekly trend is useful context, but it does not override a poor entry price or an oversized stop.
Stop-Loss Placement
For a long trade, one logical stop is below the lowest low formed during the pullback and confirmation sequence. Check the Supertrend line as well. If it sits farther below that low, a trader using a Supertrend-based exit must calculate risk to the farther level before entry. Do not size the position using a tight stop and then decide after entry to give it much more room.
For a short trade, the equivalent structural stop is above the highest high of the pullback and confirmation sequence. Again, compare it with the Supertrend line and decide which exit rule you are actually using.
A small buffer beyond the chosen level may account for normal price movement. The exact buffer should suit the instrument and be included in the risk calculation. If the stop is too far from entry, there is no need to force the trade. Reducing share quantity controls the rupee loss, but it does not make an unattractive chart setup attractive.
A stop-loss order may fill at a worse price during a fast move or an overnight gap. This is especially relevant when applying the method to daily candles.
Target and Exit Strategy
Choose an exit approach before entering. One option is a fixed reward-to-risk target, such as 2R: if the planned price risk is ₹10 per share, the target is ₹20 from entry. Check that a major resistance level for a long trade, or support for a short trade, is not sitting well before that target.
Another option is to book part of the position near an earlier swing high or low and trail the rest. A trader following the trend may move the stop behind newly formed swing points. An indicator-based exit is also possible—for example, closing after a completed candle changes the Supertrend direction.
These approaches can produce different results. A tight fixed target may exit before a trend extends. A trailing stop may give back part of an open gain before it triggers. Neither is automatically better. Test the exit rule alongside the entry rule, and define the maximum acceptable loss first.
Risk-Reward Example
Hypothetical educational example:
- Entry: ₹500
- Stop-loss: ₹490
- Planned risk: ₹10 per share
- Target at 1:2 reward-to-risk: ₹520
The ₹520 target represents a possible ₹20 move, not an expected or guaranteed result. If nearby resistance lies at ₹508, the chart may not support that target. Brokerage, taxes and slippage would also change the actual result.
Practical Indian Market Example
Imagine a hypothetical daily chart of a liquid NSE-listed stock, Reliance Industries. The following prices are invented for teaching and are not current market prices or a recent trade.
The stock has been making higher highs and higher lows. Its 20-day EMA is rising and is near ₹2,480. Supertrend remains bullish, with its line near ₹2,465.
- Setup: After rising, price pulls back. One pullback candle makes a low of ₹2,475 and a high of ₹2,492, then closes at ₹2,484. It has moved close to the EMA without closing below Supertrend.
- Confirmation: The next daily candle closes at ₹2,501, above the pullback candle’s ₹2,492 high. Its high is ₹2,505. Price is still above the EMA, and Supertrend still indicates an uptrend.
- Entry: A trader’s illustrative trigger is above ₹2,505 on a later day. Assume an entry at ₹2,507. A real order could fill at a different price.
- Stop-loss: A planned stop at ₹2,462 sits below both the ₹2,475 pullback low and the example Supertrend line near ₹2,465. The planned price risk is ₹45 per share.
- Target or exit: A 2R target would be ₹2,597, which is ₹90 above entry. The trader would first check that no nearer resistance makes that target unrealistic. Alternatively, a tested trailing-stop rule could be used. Price could hit the stop instead, and a gap could increase the loss.
The useful lesson is the sequence. Identify the trend, wait for a pullback, seek confirmation, then work out the entry, stop, target and quantity. The indicator colours alone are not the trade plan.
Zerodha Varsity: Moving Averages
When This Strategy Works Best
The approach fits a market where a trend is already visible and pullbacks remain orderly. For a long setup, that could mean higher swing lows, a rising EMA and price holding above a bullish Supertrend line. A brief pause after a breakout can also provide a more measured entry if the breakout level holds during the pullback.
Liquid stocks with clear candles are easier to review and may have tighter spreads than thinly traded shares. Even then, a favourable market condition improves the quality of the setup, not the certainty of the result.
When to Avoid This Strategy
A sideways stock can cross the EMA repeatedly while Supertrend flips direction. That creates a string of entries and exits without a sustained move. If you cannot identify the trend without relying on indicator colours, the chart may not suit this approach.
Also consider skipping a trade when:
- Price is already far from the EMA and the entry would chase a large candle.
- The stop required by the pullback structure is too distant for the available target.
- A major resistance or support level is directly in the trade’s path.
- The stock has poor liquidity or a wide spread.
- Results, a major company announcement or broad market news could cause a sharp gap.
- The confirmation candle closes weakly or Supertrend and EMA no longer agree.
There will be other charts. A missed trade is less damaging than taking one whose risk cannot be explained clearly.
False Signals and Strategy Limitations
Both indicators respond to past price data. They can confirm a trend that is already underway, but they cannot tell you how long it will last. Supertrend may switch direction after a sharp move and switch back when price settles. A moving average can flatten and produce repeated crosses in a range. TradingView’s Supertrend guide also notes that the indicator can generate false signals.
The two indicators are not independent evidence of what a company is worth. They are both derived from price, so their agreement may partly reflect the same recent move. That is why market structure, nearby levels and risk still deserve attention.
Losses are normal. One winning example does not prove that a rule works; one losing example does not prove that it never works. Evaluate the same rules over many setups and include costs and gaps in the review.
Common Mistakes Beginners Make
- Entering as soon as Supertrend changes colour, before the candle has closed.
- Assuming a rising EMA means any purchase price is reasonable.
- Buying after a large move away from the EMA, then placing a distant stop beneath the earlier pullback.
- Treating Supertrend as a guaranteed stop level.
- Moving the stop farther away after the setup has failed.
- Increasing position size because both indicators agree.
- Changing indicator settings until an old chart looks impressive, then assuming the same settings will work on future trades.
A good setup should still make sense when the indicator lines are briefly hidden and you look at the price candles.
Position Sizing and Risk Management
Decide the maximum acceptable loss before placing an order.
Take the hypothetical Reliance example. Entry at ₹2,507 and stop at ₹2,462 leave ₹45 of planned price risk per share. If the most you are prepared to lose is ₹2,000, dividing ₹2,000 by ₹45 gives 44 whole shares at most on price risk alone. At ₹2,507 each, 44 shares would require about ₹1,10,308 of purchase capital. Charges and possible slippage mean the actual loss could exceed ₹1,980, so a smaller quantity may be more suitable.
Position size must also fit the money available in the account. Do not use excessive borrowed exposure to squeeze a large position into a small risk budget. If the required stop makes the position unaffordable or the possible loss uncomfortable, skip the setup.
SEBI Investor: Key Risks in the Securities Market
Backtesting the Strategy
Choose one liquid NSE-listed stock or a small, fixed group of stocks. Use the daily timeframe for the version described here. Write down the precise settings and rules: what counts as a rising EMA, how close a pullback must come, what the confirmation candle must do, when an entry triggers and where the stop goes.
Then review a meaningful number of historical setups from different market periods. Include trades that lost money, trades that never triggered and trades that opened with a gap. Record each entry, stop, exit, charges and result. Track win rate, average reward-to-risk achieved and drawdown—how far the running results fell from a previous high.
Separate trending periods from sideways ones. You may find that the same rules behave very differently in each. Keep a record of where the method performs poorly instead of removing those trades from the sample.
Once the historical review is done, practise with paper trades or a simulator. Follow the written rules without changing them halfway through. Simulation cannot copy every live-market fill or emotion, but it can show whether you can apply the process consistently.
Simple Trading Checklist
- Is the stock liquid, with a clear trend on the daily chart?
- Is the 20-period EMA rising for a long setup or falling for a short one?
- Does Supertrend agree after the candle closes?
- Was there an orderly pullback rather than a rushed entry far from the EMA?
- Did a confirmation candle close beyond the preceding pullback candle in the trade’s direction?
- Is the entry trigger still available at a price that makes sense?
- Have I marked the structural stop and checked nearby support or resistance?
- Does the planned position size keep the possible loss within my limit?
If the chart does not answer these questions clearly, it may not be a valid setup under these rules.
Advantages and Limitations
| Advantage | Limitation |
|---|---|
| Gives a simple way to check trend direction | Both indicators react to past price movement |
| Encourages waiting for a pullback and candle confirmation | Waiting can mean a later entry or a missed move |
| Helps create clear, repeatable rules for testing | Sideways markets can produce repeated false signals |
| Offers several logical exit approaches | Overnight gaps can make the actual loss larger than planned |
Who Is This Strategy Suitable For?
Beginners can use it to practise identifying trends, pullbacks and sensible stop locations on historical charts. It is especially useful as an exercise in not taking every signal.
Swing traders may find the daily-chart version more practical because they can review completed candles after the market closes. Intraday traders can test the idea on shorter timeframes, but should not assume daily-chart settings and results will transfer directly. Positional traders may prefer longer averages and wider stops suited to their holding period. Experienced traders may add market filters, though no filter removes the possibility of a failed trade.
The right fit depends on the time a person can give the market, the size of gaps they can tolerate and whether they are comfortable waiting through ordinary pullbacks.
Key Takeaway
A rising EMA and bullish Supertrend can help describe an uptrend. A falling EMA and bearish Supertrend can help describe a downtrend. Neither combination is an instruction to enter immediately.
Wait for price to offer a clear pullback and confirmation. Check the nearest levels, work out the stop and target, and decide the share quantity before placing an order. If the trade requires chasing price or accepting more loss than planned, let it go.
Test the rules across many trades. Following a consistent process—and recording where it fails—is more useful than chasing a perfect-looking indicator signal.
5 Frequently Asked Questions
Q1. Is Supertrend alone enough to take a trade?
No. It can change direction during choppy price action. Check the candle close, broader trend, nearby levels and risk.
Q2. Why use a 20-period EMA?
It provides a simple view of recent direction for this lesson. It is a testing choice, not a universally best setting.
Q3. Can I use this strategy on a 15-minute chart?
You can test it there, but shorter timeframes may give different signals and trading costs matter more. Write and test separate intraday rules.
Q4. Should I exit immediately when price touches the EMA?
Not automatically. A touch can be part of an ordinary pullback. Follow the stop and exit rule you chose before entering.
Q5. What if price gaps past my entry or stop?
Recalculate before entering if it gaps past the trigger. A gap beyond a stop can cause a larger loss than planned, particularly in swing trading.
Further Reading
Trading Strategy 101 – Lesson 8: Bollinger Band Mean-Reversion Strategy
Trading Strategy 101 – Lesson 7: Previous Day High and Low Strategy
Trading Strategy 101 – Lesson 6: Moving Average Pullback Strategy
Trading Strategy 101 – Lesson 3: VWAP Intraday Trading Strategy
Stock Market 101 – Lesson 37: Mutual Fund Mistakes
Article Information
Author: Kartalks Education Desk
Reviewed by: Kartalks Editorial Team
Content Type: Stock market education, Supertrend indicator, EMA trend confirmation, trend-following trading strategy, bullish and bearish setups, entry and exit planning, stop-loss placement, risk-reward management, false signal awareness, and beginner trader education
Sources: SEBI investor education material, NSE/BSE educational resources, Supertrend and EMA technical analysis references, stock exchange learning resources, historical market data, and official public sources
Last Updated: November 7, 2026
Educational Disclaimer
This article is for educational and informational purposes only and is not investment or trading advice. Stock-market trading involves risk, and historical charts or hypothetical examples do not guarantee future results. Do your own research and consider consulting a SEBI-registered financial adviser before making financial decisions.