
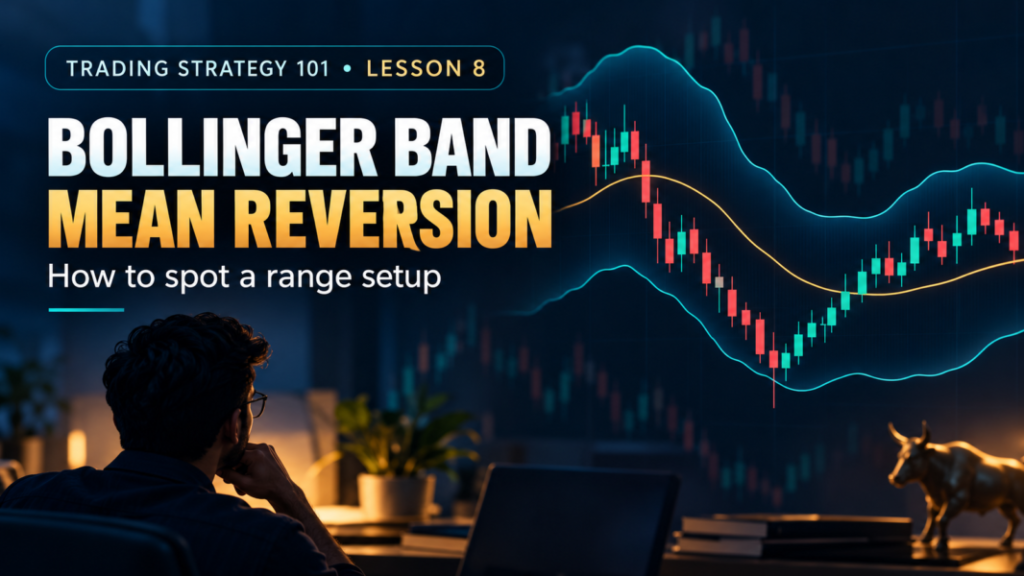
Trading Strategy 101 – Lesson 8: Bollinger Band Mean-Reversion Strategy for Beginners
Some trading days have a clear direction. On others, a stock moves up and down inside a familiar range without making much progress. The Bollinger Band mean-reversion strategy is meant for that second kind of market. It looks for a stretched move near one side of the range, then waits for signs that price may move back towards its recent average.
Intraday traders use Bollinger Bands because they show both that average and how far price has moved from it. The setup is easy to spot, but a band touch is only a starting observation. If a strong trend has begun, price may keep moving away from the average. Understanding the market condition matters more than blindly following a line on the chart.
What Is the Bollinger Band Mean-Reversion Strategy?
Bollinger Bands have three lines. The middle line is usually a 20-period simple moving average (SMA). The upper and lower lines sit two standard deviations above and below it. Standard deviation measures how much recent prices have moved around their average. The bands widen when movement increases and narrow when it settles down. These are common default settings, not compulsory settings for every market.
“Mean reversion” means a move back towards an average. Imagine a stock that has spent the morning trading between roughly ₹780 and ₹820. If it dips near the lower band but quickly returns inside it, a trader may watch for a move towards the middle line. Near the upper band, the idea works in the opposite direction.
Why might price turn? In a range, an attempt to move beyond a familiar area can lose momentum. Buyers may return near support, or sellers may appear near resistance. But an outer band is not a wall. John Bollinger warns that touching either band is not, by itself, a buy or sell signal. Price can continue along a band during a trend.
John Bollinger’s Official Bollinger Band Rules
Quick Strategy Snapshot
| Factor | Details |
|---|---|
| Trading style | Intraday in this lesson; the idea can also be studied on daily charts |
| Suitable market | A reasonably settled, range-bound market |
| Suggested timeframe | 15-minute candles for the setup; 1-hour chart for context |
| Indicators/tools | Bollinger Bands (20-period SMA, two standard deviations), volume and horizontal support/resistance |
| Difficulty | Beginner to intermediate; judging market conditions takes practice |
| Risk level | Meaningful—a failed reversal can turn into a fast breakout |
How the Strategy Works
First, look at the market before looking at the band. Has the stock been moving between visible support and resistance? Or is it making a series of higher highs or lower lows? Mean reversion has a more sensible starting point when price has been rotating within a range and the middle band is relatively flat.
Next, wait for price to reach an outer band near a range edge. That tells you the move is stretched relative to recent candles. It does not tell you the move has finished. A candle that closes back inside the band, followed by another candle moving away from the edge, gives a more useful sign that the attempted push has stalled.
Finally, check the space available. If the proposed entry is ₹8 above the stop but the middle band is only ₹5 above the entry, the usual middle-band target does not offer attractive reward for that risk. Passing on that trade is part of the method.
Zerodha Varsity: Understanding Bollinger Bands
Chart Setup
Open a 15-minute candlestick chart of a liquid NSE-listed stock. Add Bollinger Bands with a 20-period SMA and two standard deviations. Show volume bars below price. You do not need a second indicator to generate the setup.
Before considering a trade, mark nearby horizontal levels where price has turned more than once. Include a recent session high or low when relevant. Glance at the 1-hour chart too. A clear higher-timeframe trend is a warning that a reversal trade may be harder to manage.
For a repeatable practice exercise, you could use this range filter: the middle band should have changed by no more than about 0.5% over the last 10 completed 15-minute candles, and price should have reacted near both sides of a visible range. The 0.5% figure is an illustrative rule to test, not a proven threshold. If you cannot mark a range without forcing it onto the chart, skip the setup.
TradingView: Bollinger Bands Indicator Guide
Entry Conditions
These rules describe one educational version of the strategy. Use the same rules when reviewing winning and losing examples. Changing them after you know the result will not tell you much about how the method performs.
Bullish or long setup
- The stock has been trading in a visible range, with no strong downward move on the 1-hour chart.
- A completed 15-minute setup candle touches or briefly moves below the lower band, preferably near marked support, and closes back above the lower band.
- Within the next two candles, a bullish confirmation candle closes above the setup candle’s high. Price should not already have reached the middle band.
- Consider entry only if a following candle trades above the confirmation candle’s high. If price races well above that high before you can enter, recalculate the risk and be willing to skip it.
- Before entry, check that the middle band and any nearer resistance leave enough room for the reward you require relative to the stop.
Bearish or short setup
Use the mirror image: a range with no strong 1-hour uptrend; a setup candle that touches or crosses the upper band near resistance, then closes below it; and a bearish confirmation candle within the next two candles that closes below the setup candle’s low. A subsequent move below the confirmation candle’s low is the possible entry trigger. Check the distance to the middle band and any nearer support first.
Short selling an equity share intraday involves broker and exchange rules and must be closed as required. Beginners can study the short setup on charts without feeling obliged to trade it. An index such as Nifty 50 can be useful for observing price action, but the index itself is not a directly tradable share.
Confirmation Before Entry
The most useful confirmation here is the close back inside the band, followed by a candle moving away from the range edge. A wick outside the band and a close inside can show rejection. A close outside may instead be the beginning of a breakout. Waiting for the next candle helps prevent an entry based on one brief bounce.
Compare that candle with its surroundings. A lower-band rejection near earlier support makes more sense than a dip at an unmarked price. Normal trading volume and an established range can support the reading. A sudden volume surge with a decisive close beyond support may warn of a genuine break instead. Volume provides context; it is not a magic pass-or-fail number.
The 1-hour chart matters as well. If it shows a sharp trend against the proposed trade, an attractive-looking 15-minute candle may still struggle to produce a move back to the average.
Stop-Loss Placement
For a long setup, plan the stop a little below the lowest low made from the band-touch candle through the entry trigger. For a short setup, place it a little above the highest high of that sequence. A small buffer can account for the stock’s normal tick movement. It is not a reason to keep widening the stop after entry.
The location has a purpose. If price breaks the rejection low again, the proposed bounce has lost its footing. If the stop is so far away that the middle-band target offers poor reward-to-risk, reject the trade or reduce the position size.
A stop order can execute with slippage, especially during a fast move. The planned loss is therefore an estimate, not a guarantee of the exact exit price.
Target and Exit Strategy
Decide how you will exit before placing the order. A straightforward first target is the middle band’s value at entry, treated as a fixed price for planning. The moving line changes with later candles; fixing the reference avoids quietly moving your target after the trade begins.
A nearby resistance level for a long trade, or support for a short trade, may require an earlier exit. Some traders instead test a fixed 1:2 reward-to-risk target, take part of the position near the middle band, or trail a stop behind new swing lows or highs if the move continues.
These are different exit rules to evaluate. None means the far band—or even the middle band—must be reached. If price stalls, prints a strong candle against the position, or the session nears its end, an intraday trader may close the trade rather than wait indefinitely. Define your maximum planned risk before entry.
Risk-Reward Example
Hypothetical educational calculation: A share is entered at ₹500 with a stop-loss at ₹490. The planned risk is ₹10 per share. A 1:2 target would be ₹520, offering a possible ₹20 gain per share if reached.
If resistance lies at ₹507, however, the chart may not support that target. The trader needs a different exit plan or should pass on the setup. Brokerage, taxes and slippage affect the actual result too.
SEBI Investor: Understanding Securities Market Risks
Practical Indian Market Example
Suppose an imaginary session in SBI shares shows a broad sideways area. The 15-minute middle band is around ₹812 and the lower band near ₹790. These prices are invented to explain the chart sequence; they are not current quotes.
- Setup: A candle briefly touches ₹789 near marked support and closes at ₹792, back inside the lower band. Its high is ₹793.
- Confirmation: The next candle closes at ₹794.50, above that ₹793 high. Its own high is ₹795.
- Entry: A later candle trades above ₹795. The example assumes a fill at ₹796; a real fill could differ.
- Stop-loss: A planned stop at ₹788 sits below the ₹789 rejection low. That is ₹8 of price risk per share, before costs or slippage.
- Target or exit: If the middle band at entry is ₹812 and no nearer resistance blocks the way, that target is ₹16 above entry, or 2R. A move below the rejection low would instead point towards the planned loss-making exit. The target may never trade.
Notice the order of decisions: range first, rejection second, entry trigger third. Position size comes only after the stop and possible target are known.
When This Strategy Works Best
The idea is most reasonable when a liquid stock has been moving between recognisable boundaries, the middle band is fairly flat, and recent moves beyond the outer bands have struggled to continue. A brief push into support or resistance, followed by a close back within the band, gives the trader a structure to work with.
This is a range approach. A strong trend or a high-volume breakout is a different market condition. Do not call every sharp fall “oversold” and expect an immediate bounce.
When to Avoid This Strategy
Avoid forcing a reversal when the stock keeps closing beyond an outer band and the middle band is clearly sloping. A series of closes near one band can be a trend, not repeated opportunities to trade against it.
Be careful around earnings, major policy announcements or other events that can change the trading range suddenly. Thinly traded shares may have wide spreads and unreliable candles.
Skip the setup when there is no clear close back inside the band, price has already travelled close to the middle band before entry, or a nearby level leaves poor reward for the stop required. If the chart looks chaotic rather than range-bound, waiting is a valid decision.
False Signals and Strategy Limitations
Bollinger Bands are calculated from past prices. They adjust as price movement changes, but cannot tell you why traders are suddenly buying or selling. A rejection candle can look convincing and still fail on the next bar.
During a breakout, price may “walk” along an outer band. The upper band need not trigger selling, and the lower band need not trigger buying.
Fidelity: What Are Bollinger Bands?
A range can also break after several successful bounces. Losses are part of trading. Judge a set of rules over many trades and different market conditions, rather than treating one profitable example as proof that it works.
Common Mistakes Beginners Make
- Buying the first lower-band touch or shorting the first upper-band touch without waiting for a close and confirmation.
- Calling a strong trend a “range” because the current candle looks stretched.
- Entering so late that the middle band is too close to justify the stop.
- Setting the stop exactly on an obvious wick, then moving it farther away when price returns there.
- Increasing position size after a loss to recover it quickly.
- Judging the method from a few attractive chart screenshots without counting failed signals and trading costs.
Position Sizing and Risk Management
Ask, “How much am I prepared to lose on this idea?” before asking how many shares to buy.
Suppose your maximum planned loss is ₹250, and you allow ₹30 for estimated charges and some slippage. That leaves ₹220 for price risk. With an ₹8 gap between entry and stop, ₹220 ÷ ₹8 gives 27 whole shares at most. At the example entry of ₹796, 27 shares require ₹21,492 of purchase capital. You must also check your available funds and broker requirements.
If the stock moves too quickly for the planned stop to remain meaningful, reduce the quantity or pass. Actual costs and slippage may exceed the allowance, especially in a fast market. Keep the position within a loss limit you can handle.
Backtesting the Strategy
Start with one liquid NSE stock and a 15-minute chart. Write down the range filter, band settings, exact setup and confirmation candles, entry trigger, stop buffer and exit rule. Decide beforehand how you will handle a gap, a missed entry trigger and the end of the trading session.
Review a meaningful sample of historical setups across different weeks and market conditions. Record every valid setup, including losses and trades that never triggered. Note the entry, stop, exit, costs, win or loss in rupees, and reward-to-risk actually achieved. Track drawdown too—the deepest decline in your running results.
Look at average reward-to-risk alongside win rate. A high win rate alone does not show whether gains cover the losses. Mark where the rules struggled, particularly on strong-trend or event-driven days.
After reviewing historical charts, paper trade or use a simulator with the same rules. Live trading adds spreads, imperfect fills and emotions that a clean historical chart cannot fully show.
Simple Trading Checklist
- Is this a liquid stock in a visible range, with a reasonably flat middle band?
- Is the 1-hour chart free of a strong trend against the proposed trade?
- Did the setup candle touch an outer band near a marked range edge and close back inside?
- Did a confirmation candle close beyond the setup candle in the expected direction?
- Is the entry trigger still ahead, rather than already chased?
- Are the structural stop, target, costs and share quantity defined before entry?
- Does the middle band or nearer support/resistance leave enough reward for the risk?
If an important answer is “no”, it is not the setup you planned to trade.
Advantages and Limitations
| Advantage | Limitation |
|---|---|
| Shows a recent average and relative price extremes on one chart | An extreme can continue during a trend |
| Gives a clear area to watch for a range rejection | Bands do not identify support or resistance by themselves |
| Supports a structure-based stop and a middle-band target | A wide stop or nearby target can spoil reward-to-risk |
| Rules can be written down and tested | Historical results may look better than live fills after costs |
Who Is This Strategy Suitable For?
Beginners can use it to practise reading ranges and planning risk on historical charts. For live intraday trading, they also need to be comfortable waiting for a completed candle, skipping weak setups and closing positions within the day.
Swing traders can study the same principle on daily candles, but should test separate rules for overnight gaps and longer holding periods. Positional traders seeking sustained trends may find a range-reversion exit too early. Experienced traders may add their own market filters, though experience does not remove the chance of a failed reversal.
Key Takeaway
Bollinger Bands help show when price is relatively far from its recent average. They do not say price must return. A visible range, a close back inside an outer band and a separate confirmation candle make the idea more specific.
Plan the stop, realistic target and number of shares before entry. Sometimes the best decision is to leave the trade alone because the market is trending or the possible reward is too small.
Test the same rules over enough examples to see both ordinary losses and uncomfortable runs of losses. Consistency in the process matters more than the outcome of any single chart.
5 Frequently Asked Questions
Q1. Does touching the lower Bollinger Band mean a stock is a buy?
No. It only shows that price is low relative to its recent average. In a downtrend, it can keep falling.
Q2. Why use the middle band as a target?
It represents the recent average, so it is a natural first place to assess a range trade. Price is not obliged to reach it.
Q3. Are the 20-period and two-standard-deviation settings compulsory?
No. They are common defaults. If you change them, test the new settings and keep your rules consistent.
Q4. Can I use this on Nifty 50?
You can study the index chart. Trading an index view requires a suitable instrument with its own costs and risks; the index itself is not a share you can buy.
Q5. Is a narrower band always a better setup?
No. Narrow bands show calmer recent movement, but a sharp breakout can follow. Wait for the range and reversal conditions rather than trading band width alone.
Further Reading
Trading Strategy 101 – Lesson 7: Previous Day High and Low Strategy
Trading Strategy 101 – Lesson 5: RSI + Price Action Trading Strategy
Trading Strategy 101 – Lesson 3: VWAP Intraday Trading Strategy
Stock Market 101 – Lesson 35: Mutual Fund Metrics Made Simple
Stock Market 101 – Lesson 30: Defensive vs Cyclical Sectors
Article Information
Author: Kartalks Education Desk
Reviewed by: Kartalks Editorial Team
Content Type: Stock market education, Bollinger Bands trading strategy, mean-reversion trading, overbought and oversold conditions, volatility analysis, price action confirmation, entry and exit planning, stop-loss placement, risk management, false signal awareness, and beginner trader education
Sources: SEBI investor education material, NSE/BSE educational resources, Bollinger Bands technical analysis references, volatility indicator learning resources, and official public sources
Last Updated: October 31, 2026
Educational Disclaimer
This article is for educational and informational purposes only, not investment or trading advice. Stock-market trading involves risk. Historical charts and hypothetical examples do not guarantee future results. Do your own research and consider consulting a SEBI-registered financial adviser before making financial decisions.