
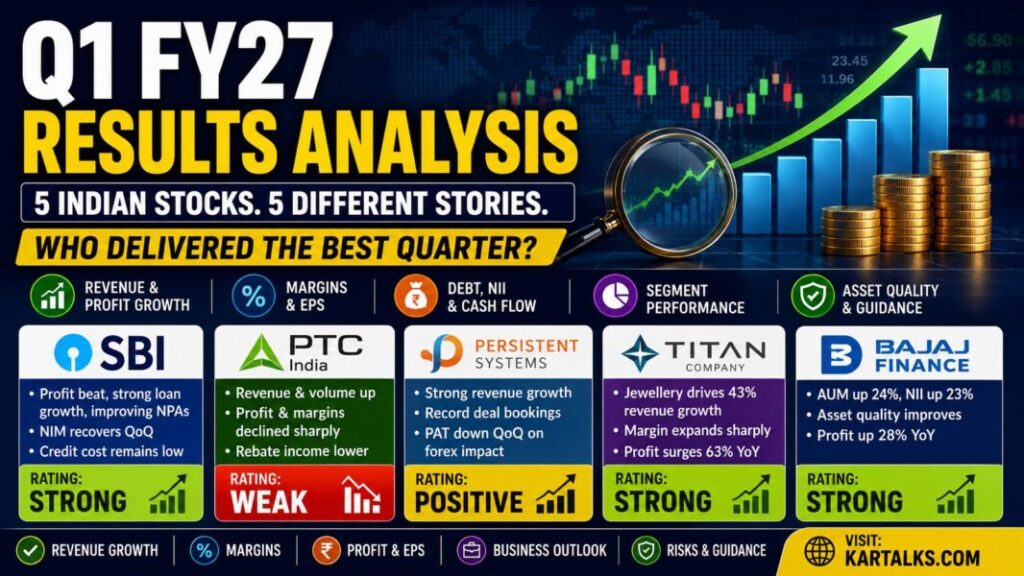
SBI, PTC India, Persistent Systems, Titan and Bajaj Finance Q1 FY27 Results Analysis
The latest Q1 FY27 earnings from these five companies present a fairly interesting mix.
SBI surprised the market with stronger profit, loan growth and improving asset quality. Persistent Systems continued its long run of revenue growth and reported record deal bookings. Titan delivered one of its strongest quarters, helped by jewellery demand and better margins.
Bajaj Finance also reported a solid quarter with strong AUM growth and improving asset quality. PTC India was the clear weak spot: power-trading volumes increased, but lower rebate and surcharge income pulled profit sharply lower.
This analysis uses results for the quarter ended 30 June 2026, with official company and exchange filings as the main source.
Q1 FY27 Results: Quick Comparison
| Company | Q1 FY27 takeaway | Rating |
|---|---|---|
| SBI | Profit beat, strong credit growth and improving NPA ratios | Strong |
| PTC India | Revenue and volumes grew, but profit and margins fell sharply | Weak |
| Persistent Systems | Strong revenue, record bookings, but PAT fell QoQ | Positive |
| Titan | Strong jewellery-led growth and major margin improvement | Strong |
| Bajaj Finance | Strong AUM, NII and PAT growth with improving asset quality | Strong |
Before getting into the numbers, one small point is important. SBI and Bajaj Finance are financial companies, so EBITDA and EBITDA margin are not the right measures. For them, net interest income, operating profit, NIM, credit cost and asset quality give investors a much better picture.
SBI Q1 FY27 Results Analysis
State Bank of India delivered a much better quarter than the market had expected.
Standalone net profit increased 10.2% YoY and 7.3% QoQ to ₹21,121 crore. Net interest income rose 14.9% YoY and 5.9% QoQ to ₹46,992 crore. Operating profit reached ₹33,529 crore, up 9.8% YoY and 21% sequentially.
This combination of healthy loan growth, NII growth and lower credit cost made the result stronger than the headline 10% profit growth may suggest.
SBI Margin Movement
Domestic NIM stood at 3.00%, compared with 3.01% in Q1 FY26 and 2.93% in Q4 FY26.
So margin was almost flat YoY but improved 7 basis points sequentially. Whole-bank NIM improved 5 bps QoQ to 2.86%.
That sequential recovery is encouraging because deposit costs have been a major worry across the banking sector.
SBI EPS, Funding and Balance Sheet
Annualised EPS stood at ₹91.78, compared with ₹86.11 in Q1 FY26.
Gross advances increased 18.6% YoY to ₹50.47 lakh crore, while deposits grew 9.7% to ₹60.06 lakh crore.
The difference between loan and deposit growth needs monitoring, though SBI still has a large deposit franchise. CASA ratio eased slightly to 39.24%.
Capital adequacy improved to 15.67%, while CET1 increased to 12.89%.
SBI Segment-Wise Loan Growth
Growth was broad-based:
- Agriculture advances: +25.4%
- SME advances: +22.3%
- Corporate advances: +18.1%
- Retail personal loans: +15.2%
- Home loans: +12.8%
RAM — Retail, Agriculture and MSME — advances increased 18.2% YoY.
SBI therefore did not depend on a single segment for loan growth.
Asset Quality and Other Income
Gross NPA improved to 1.47%, from 1.83% a year ago. Net NPA fell to 0.38%.
Credit cost declined to 0.27%, from 0.47% in Q1 FY26. Loan-loss provisions dropped nearly 32% YoY to ₹3,359 crore.
Non-interest income, however, declined 9.1% YoY to ₹15,923 crore, partly because gains from investment sales and forex-related income were weaker.
That makes the NII and lending performance even more important.
SBI Subsidiaries
Several SBI subsidiaries also contributed well.
SBI Life reported PAT growth of 22%, SBI Card profit increased 19%, and SBI Funds Management earned ₹873 crore during the quarter.
This gives SBI additional earnings diversification beyond traditional banking.
Performance Versus Market Expectations
SBI clearly beat expectations.
Its ₹21,121 crore profit was well above the LSEG analyst consensus of around ₹19,102 crore.
Strong credit growth and better asset quality were the biggest positive surprises.
SBI Positives
- Profit comfortably beat expectations
- NII grew nearly 15%
- Domestic NIM recovered QoQ
- Loans grew nearly 19%
- GNPA and NNPA improved
- Credit cost remained low
- Capital adequacy strengthened
SBI Risks
- Deposits are growing slower than loans
- CASA ratio softened
- Slippages increased sequentially
- Treasury and forex income can remain volatile
- Strong credit growth needs continued asset-quality discipline
SBI Q1 FY27 Rating: Strong
The quarter had a good mix of growth, profitability and asset quality. SBI was one of the strongest banking results of Q1 FY27.
Official source: SBI Q1 FY27 Results
PTC India Q1 FY27 Results Analysis
PTC India’s result was much weaker.
The company continued to grow its core power-trading volumes, but that did not translate into profit growth.
Consolidated revenue rose to around ₹4,774 crore, from about ₹4,009 crore a year earlier, an increase of roughly 19%. Trading volume increased 12% YoY to 25,783 million units.
Yet consolidated PAT fell sharply to ₹112.08 crore, from ₹242.88 crore in Q1 FY26. It was also lower than the ₹121.27 crore reported in Q4 FY26.
That means profit declined roughly 54% YoY and 8% QoQ.
PTC India EBITDA and Margin
Consolidated EBITDA was around ₹150 crore, compared with roughly ₹290 crore a year earlier.
EBITDA margin fell to around 3.2%, from close to 7% in Q1 FY26.
This is the biggest concern in the result.
Revenue increased, but the earnings generated on that revenue dropped sharply.
EPS
Quarterly EPS was approximately ₹3.3 per share, compared with around ₹6.6 in the year-ago period.
The EPS decline mirrors the fall in profit.
Why Did Profit Fall?
PTC’s trading business itself remained active. Trading income increased and volumes grew.
The problem was lower rebate and surcharge income, which had supported the previous-year quarter. Core power-segment profitability therefore weakened despite higher volumes.
PTC also owns a controlling stake in PTC India Financial Services, so the subsidiary’s profitability and regulatory position can affect consolidated earnings.
Segment Performance
Power Trading
Trading volumes increased 12% YoY to 25,783 million units.
Management said the mix of short-, medium- and long-term contracts supported growth.
The volume trend is positive.
The margin earned on those volumes, however, remains more important than volume alone.
Financial Services
PTC India Financial Services remains the group’s financing arm.
This business has improved asset quality over recent quarters, but regulatory compliance and portfolio concentration in infrastructure remain areas investors should track.
Exceptional Items and Dividend
There was no comparable large gain supporting Q1 FY27 earnings.
The board nevertheless approved a sizeable ₹23 per share interim dividend, with August 10, 2026 as the record date.
The dividend is attractive, but investors should not confuse a high dividend payout with improving operating performance.
Management Outlook
Management remains constructive about reforms in the Indian electricity market, including market coupling, virtual power purchase agreements and new market-based products.
These may expand PTC’s opportunity over time.
The near-term issue is whether higher trading volumes can again generate better margins.
Main Positives
- Trading volume grew 12%
- Revenue increased
- Strong position in Indian power trading
- Large interim dividend
- New power-market reforms can create future opportunities
Main Negatives and Risks
- PAT fell more than 50% YoY
- EBITDA nearly halved
- EBITDA margin contracted sharply
- Lower rebate and surcharge income
- PFS-related regulatory and execution risks
- Earnings can remain volatile even when volumes grow
PTC India Q1 FY27 Rating: Weak
Operational volume growth was decent, but profit quality and margins deteriorated too sharply to overlook.
Official company source: PTC India Financial Results
Persistent Systems Q1 FY27 Results Analysis
Persistent Systems continued its impressive revenue-growth streak.
Dollar revenue reached $452.4 million, up 16.1% YoY and 3.8% QoQ. Constant-currency growth was 16.5% YoY and 4.1% sequentially.
Rupee revenue jumped 29.1% YoY and 6.1% QoQ to ₹4,303 crore, helped partly by currency movement.
Operating Profit and Margin
Persistent reports EBIT rather than highlighting EBITDA.
EBIT rose 32.7% YoY and 4.2% QoQ to ₹687 crore.
EBIT margin was 16.0%, compared with:
- 15.5% in Q1 FY26
- 16.3% in Q4 FY26
So margin expanded 50 bps YoY but declined 30 bps sequentially.
The YoY improvement is positive, especially given ongoing investment in AI capabilities and talent.
Net Profit and EPS
PAT increased 13.7% YoY to ₹483 crore, but declined 8.7% sequentially.
The sequential drop was mainly due to forex losses.
EPS stood at ₹30.9, compared with ₹27.7 in Q1 FY26 and ₹33.8 in Q4 FY26.
This means core operations improved even though reported QoQ profit weakened.
Cash, Working Capital and Debt
Cash and investments stood at roughly ₹2,704 crore at the end of June, compared with ₹2,762 crore in March.
Operating-cash-flow conversion on a trailing basis was 76.2% of PAT, down from 94.7% in the previous quarter. Days sales outstanding also increased.
Persistent remains financially comfortable, but cash conversion is one metric worth watching.
Segment-Wise Performance
Growth remained broad-based.
Q1 revenue by industry was approximately:
- Software, Hi-Tech and Emerging Industries: $184 million
- BFSI: $153.7 million
- Healthcare and Life Sciences: $114.7 million
YoY growth across these verticals remained in the mid-teens.
This diversification is useful because it reduces dependence on a single industry.
Record Deal Wins
The strongest number in the quarter may actually be bookings.
Total contract value reached an all-time quarterly high of $1.146 billion, while ACV stood at $536.8 million.
The deal pipeline included work across AI, data modernisation, cloud security, banking platforms and healthcare technology.
That gives better revenue visibility for coming quarters.
Exceptional Items and Other Income
There was no large exceptional operating gain.
However, forex movement hurt PBT and PAT sequentially. PBT fell 7.5% QoQ and PAT declined 8.7%, despite EBIT growth.
Investors should therefore separate the core EBIT trend from treasury and currency effects.
Management Outlook
Management continues to position Persistent around AI-led digital engineering, cloud modernisation, data platforms and enterprise automation.
The planned combination with Nagarro also creates a much larger global technology-services platform, though integration carries execution risk.
Main Positives
- 25 consecutive quarters of sequential dollar revenue growth
- Constant-currency growth above 16% YoY
- EBIT grew faster than revenue
- Record quarterly bookings
- Broad-based industry growth
- Strong AI and digital engineering positioning
Main Negatives and Risks
- PAT declined QoQ
- EBIT margin softened sequentially
- Cash conversion weakened
- Forex volatility affected profit
- Nagarro integration adds execution risk
- Premium valuation raises expectations
Persistent Systems Q1 FY27 Rating: Positive
The operating quarter was strong. Record bookings are particularly encouraging, though weaker QoQ PAT and slightly lower margin keep the rating below “Strong”.
Official source: Persistent Systems Q1 FY27 Results
Titan Q1 FY27 Results Analysis
Titan delivered one of the best consumer-sector results this quarter.
Consolidated total income increased about 40% YoY to ₹20,753 crore, while PAT surged 63% to ₹1,777 crore.
Compared with Q4 FY26, total income increased roughly 2%, while PAT jumped about 51% from ₹1,179 crore.
The sharp sequential profit increase reflects a much better margin mix.
Titan EBIT and Margin
Consolidated EBIT increased nearly 59% YoY to ₹2,782 crore.
EBIT margin improved to 13.4%, from around 11.8% in Q1 FY26.
This margin expansion was one of the biggest positives in Titan’s result.
A change in customs-duty economics and stronger product mix supported jewellery profitability.
EPS
With consolidated PAT of ₹1,777 crore, quarterly EPS was close to ₹20 per share.
That is materially higher than the comparable year-ago quarter and also above the pre-result consensus EPS estimate of around ₹14.50.
Segment-Wise Performance
Jewellery
Jewellery remains the core engine.
The jewellery portfolio grew 43% YoY, with domestic jewellery income excluding bullion and Digi-Gold reaching around ₹15,502 crore. CaratLane revenue rose 40% to ₹1,441 crore.
Jewellery EBIT margin improved as customers continued to buy higher-value and higher-margin products.
Watches
Watches continued to grow, helped by premiumisation and stronger demand for analogue and smart-wear products.
EyeCare
EyeCare revenue increased about 21% YoY to ₹289 crore, marking a healthy start to FY27.
International Business
Titan continues expanding internationally, especially in the Middle East.
However, the regional conflict affected traffic and spending, and the Damas operation reported a quarterly loss.
Cash Flow, Debt and Interest Cost
Titan’s working capital naturally rises when gold prices and jewellery inventory increase.
The company therefore needs to be judged not just on reported debt but on inventory turns, gold-metal-loan utilisation and operating cash generation.
High gold prices can temporarily increase borrowings even when underlying business performance remains healthy.
Management Guidance
Management continues to target double-digit annual jewellery revenue growth over the medium term.
The company also plans to keep expanding its retail footprint. Titan’s total store network reached about 3,680 locations during Q1.
Gold-price volatility remains the main near-term demand risk.
Performance Versus Market Expectations
Titan’s result was stronger than consensus.
Before the announcement, the consensus revenue estimate was around ₹19,817 crore, while reported income crossed ₹20,700 crore.
Profit growth was also significantly stronger than expected.
Titan Positives
- 40% income growth
- PAT increased 63%
- Major EBIT-margin expansion
- Strong jewellery demand
- CaratLane growing rapidly
- EyeCare grew 21%
- Continued market-share gains
Titan Risks
- Gold-price volatility can hurt volumes
- Jewellery contributes the majority of earnings
- International expansion carries execution risk
- Middle East business affected by regional conflict
- High valuation demands sustained growth
Titan Q1 FY27 Rating: Strong
Revenue growth was excellent, but the real standout was the margin and profit improvement.
Official source: Titan Company Quarterly Results
Bajaj Finance Q1 FY27 Results Analysis
Bajaj Finance reported another strong quarter.
For an NBFC, EBITDA is not a meaningful measure. The better indicators are NII, pre-provision operating profit, AUM growth, credit cost and asset quality.
Consolidated NII increased 23% YoY to ₹12,571 crore, while pre-provision operating profit grew 22% to ₹10,137 crore.
Consolidated PAT increased 28% YoY to ₹6,081 crore.
AUM Growth
Consolidated AUM rose 24% YoY to ₹5.47 lakh crore.
Bajaj Finance added a record ₹36,969 crore of AUM during the quarter. New loans booked increased 20% to 16.13 million.
Customer franchise reached 124.43 million after adding 5.10 million customers during Q1.
This remains one of Bajaj Finance’s biggest competitive strengths.
Margin and Cost of Funds
Management said NIM remained broadly steady in Q1.
Cost of funds improved marginally to 7.40%, one basis point better than Q4 FY26.
The ability to protect spreads despite competitive funding markets was a positive.
EPS
Consolidated basic EPS stood at ₹9.62, compared with ₹7.57 in Q1 FY26.
EPS growth closely followed the rise in consolidated profit.
Liquidity, Borrowings and Deposits
Liquidity buffer stood at ₹17,847 crore.
The deposits book reached ₹68,534 crore and funded around 15% of consolidated borrowings.
Capital adequacy remained healthy at 20.90%, with Tier-1 capital at 20.01%.
So funding availability is not currently a major concern.
Asset Quality and Credit Cost
Gross NPA improved to 0.96%, from 1.03% a year earlier.
Net NPA improved to 0.39%, from 0.50%.
Loan losses and provisions increased only 1% YoY to ₹1,993 crore, despite rapid AUM growth.
Importantly, this included a prudent management and macro provision of ₹296 crore. Excluding that amount, loan losses and provisions actually fell 14% YoY.
That makes the credit-quality trend encouraging.
Segment-Wise Performance
Core Bajaj Finance
Standalone AUM increased 23% YoY to around ₹4 lakh crore.
Standalone PAT increased 29% to ₹5,346 crore.
Bajaj Housing Finance
Housing-finance AUM grew 24% to ₹1.50 lakh crore.
PAT increased 23% to ₹715 crore, while GNPA remained very low at 0.29%.
Bajaj Financial Securities
AUM increased 60% to ₹9,770 crore, while PAT rose 22% to ₹50 crore.
This adds another growing fee and financing business to the group.
Management Guidance
Bajaj Finance expects to:
- Book 60–62 million new loans in FY27
- Add 18–20 million customers
- Open 150–175 new locations
- Expand gold-loan branches to 2,700–2,800
- Improve the opex-to-net-total-income ratio by 25–40 bps
Management also remains optimistic about the FY27 credit-cost outlook, subject to geopolitical conditions.
Performance Versus Market Expectations
Bajaj Finance beat estimates.
Consolidated PAT of ₹6,081 crore was above the LSEG consensus estimate of approximately ₹5,856 crore.
The strong NII growth and improving asset quality also prompted several brokerages to raise target prices after the result.
Bajaj Finance Positives
- AUM grew 24%
- NII increased 23%
- PAT rose 28%
- Asset quality improved
- Credit cost trend is encouraging
- Cost of funds stabilised
- Strong housing-finance growth
Bajaj Finance Risks
- Rapid loan growth must be monitored for future credit stress
- Unsecured lending remains sensitive to economic weakness
- Funding costs can rise again
- Regulatory changes can affect NBFC growth
- Valuation remains demanding
- Geographic and product expansion increases execution complexity
Bajaj Finance Q1 FY27 Rating: Strong
Growth, profitability and asset quality all moved in the right direction. This was a high-quality quarter.
Official source: Bajaj Finance Q1 FY27 Investor Presentation
Final Q1 FY27 Ranking
1. Titan — Strong
Titan delivered the strongest operating surprise. Revenue grew rapidly, jewellery remained strong and margins expanded meaningfully.
2. Bajaj Finance — Strong
AUM, NII and PAT all grew above 20%, while asset quality improved.
3. SBI — Strong
SBI comfortably beat market expectations, with strong lending growth, improving NIM QoQ and low credit cost.
4. Persistent Systems — Positive
The company maintained strong revenue growth and reported record bookings. The only concern was weaker sequential PAT and slightly lower margin.
5. PTC India — Weak
Trading volumes and revenue increased, but EBITDA and PAT declined sharply. Margin recovery is now the key indicator to watch.
What Investors Should Watch in Q2 FY27
For SBI, watch deposit growth, NIM and slippages.
For PTC India, the most important number is trading margin rather than just trading volume.
For Persistent, watch record deal-book conversion, EBIT margin and cash conversion.
For Titan, track gold prices, jewellery margins and international expansion.
For Bajaj Finance, focus on credit cost, unsecured-loan asset quality, AUM growth and funding costs.
Quarterly results are only one part of stock analysis. A strong quarter can already be priced into the share, while a weak quarter may sometimes be temporary. Valuation, balance-sheet quality, future growth and management execution should be checked together before taking an investment decision.
FAQs
Q1. Which stock reported the strongest Q1 FY27 results?
Titan, Bajaj Finance and SBI delivered strong overall results, with healthy profit growth and solid operating performance.
Q2. Why was SBI rated Strong?
SBI reported a profit beat, strong loan growth, improving asset quality and better sequential net interest margin.
Q3. Was Titan Q1 FY27 result strong?
Yes. Titan reported strong jewellery-led revenue growth, sharp profit growth and better operating margins.
Q4. Why was Persistent Systems rated Positive?
Persistent reported healthy revenue growth and record deal bookings, but sequential profit and margins were slightly weaker.
Q5. Why was PTC India rated Weak?
PTC India reported higher trading volumes and revenue, but EBITDA, margins and profit declined sharply.
Further Reading
Banking Sector Q1 FY27 Results Analysis for 5 Important Stocks
Q1 FY27 Results Analysis: Reliance, TCS, HCL Tech, Jio Financial and DMart
Stock Market 101 – Lesson 36: SIP Strategy Upgrade
Gold vs Silver vs Gold ETF: Where Should Indian Investors Look in 2026?
Disclaimer:
This article is for educational and informational purposes only and should not be treated as investment advice. Stock-market investments carry risk. Please review company filings, valuation and your own financial situation before investing.
Article Information
Author: Kartalks Research Desk
Reviewed by: Kartalks Editorial Team
Content Type: Q1 FY27 results analysis, quarterly earnings summary, revenue and profit performance, margin review, company fundamentals, sector outlook, management commentary, risk factors, valuation awareness, and investor education
Sources: NSE, BSE, company exchange filings, quarterly results, investor presentations, annual reports, management commentary, SEBI updates, and official public sources
Last Updated: August 8, 2026
Including segment wise performance along with results analysis is very useful.
Thank you.
Thank you! We’re glad you found the segment-wise performance and results analysis useful.