Indian Markets Weekly View (June 8–June 12, 2026): Cautious Sentiment, Sell-on-Rise Bias, and RBI Aftermath in Focus
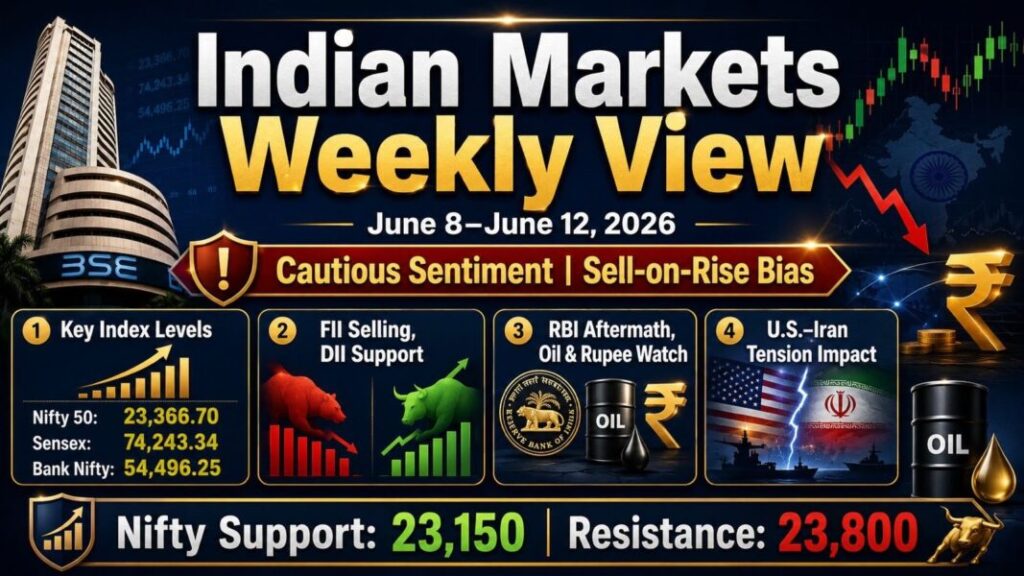
The Indian Markets Weekly View for June 8–June 12, 2026 begins with a cautious tone. Indian benchmarks ended the last session lower after the RBI held rates, cut its FY27 growth forecast to 6.6% from 6.9%, and raised its inflation forecast to 5.1% from 4.6%, while foreign outflows and oil-linked macro stress kept sentiment under pressure. On June 5, the Nifty 50 closed at 23,366.70, the Sensex at 74,243.34, and Nifty Bank at 54,496.25. The Nifty lost about 0.8% for the week, the Sensex about 0.7%, and India VIX ended the week at 15.79, slightly lower week-on-week but still high enough to keep traders defensive.
Quick takeaway
- Nifty is still below its key recovery zone near 23,700–24,000.
- Bank Nifty is holding above 54,000, but upside remains capped below 55,250–56,000.
- Oil, rupee, FII flows, and the post-RBI macro reset remain the main market drivers for the week ahead.
📊 Indian Markets Weekly View: Quick Market Snapshot
| Index / Indicator | Latest reading | Weekly tone |
|---|---|---|
| Nifty 50 | 23,366.70 | Weak |
| Sensex | 74,243.34 | Weak |
| Bank Nifty | 54,496.25 | Relatively better than Nifty |
| India VIX | 15.79 | Volatility still elevated |
| GIFT Nifty | 23,091 | Sharp negative opening cue |
The table above is based on the June 5 close, the latest Bank Nifty index reading, ET’s weekly wrap, and Business Today’s weekend setup note, which said GIFT Nifty was down 356 points to 23,091, pointing to a rough Monday start.
In plain terms, this is not a panic market, but it is not a confident bullish market either. The broader structure still looks like a range with a negative bias, especially after Friday’s late weakness and the sharp overnight selloff in U.S. markets that Business Today highlighted in its June 8 preview.
🔑 Indian Markets Weekly View: Current Key Levels, Weekly Levels and View
Business Today’s June 8 setup says the market is entering the week with a sell-on-rise approach until the Nifty decisively reclaims stronger resistance levels. The article identifies 23,250–23,150 as the first key support zone for Nifty, warns that a break below 23,150 can drag the index toward 23,000 and even 22,800, and places 23,500–23,550 as immediate resistance, followed by 23,750–23,800 and then 24,000 as the major ceiling.
Nifty 50 support and resistance
| Level type | Zone |
|---|---|
| Immediate support | 23,250–23,150 |
| Major support | 23,000 |
| Deeper support | 22,800 |
| Immediate resistance | 23,500–23,550 |
| Key resistance | 23,750–23,800 |
| Major hurdle | 24,000 |
Reading: Nifty needs to reclaim 23,700–23,800 first. Until that happens, rallies may continue to face selling pressure.
Sensex support and resistance
| Level type | Zone |
|---|---|
| Immediate support | 74,000–73,800 |
| Immediate resistance | 74,600–74,800 |
| Major resistance | 75,500–75,800 |
Business Today’s June 8 note places immediate Sensex support around 74,000–73,800 and overhead resistance near 74,600–74,800, with a stronger supply band at 75,500–75,800.
Bank Nifty support and resistance
| Level type | Zone |
|---|---|
| Immediate support | 54,000 |
| Lower support | 53,500–53,200 |
| Immediate resistance | 54,600–54,700 |
| Major resistance | 55,250 |
| Higher hurdle | 55,800–56,100 |
Bank Nifty closed at 54,496.25 and remains a little sturdier than the Nifty, but it is still below its more important recovery band. Market commentary around the June 5 close and current Bank Nifty index data suggest 54,000 is the first line of defense, while the 50-DEMA zone near 55,250 remains a major hurdle.
Weekly range forecast
For this Indian Markets Weekly View, a practical weekly range looks like this:
- Nifty 50: 22,800 – 24,000
- Sensex: 73,800 – 75,800
- Bank Nifty: 53,200 – 56,100
This is an inference from the cited support and resistance zones, not an official exchange forecast.
💼FII and DII Overview in Last Week
FII-DII flows remained one of the clearest pressure points. Business Today said FIIs posted net outflows of about ₹31,114.47 crore in the first week of June, while DIIs provided support with net inflows of about ₹33,933.05 crore. That tells you domestic institutions are still absorbing the damage, but foreign conviction is still missing.
Economic Times separately reported that FIIs pulled out ₹20,637 crore in a single day on the Friday of the prior week, underscoring how fragile foreign risk appetite remains. That kind of outflow is exactly why the market is acting more like a stock-pickers’ tape than a broad rally environment.
What the flow data means
- DIIs are still cushioning the downside.
- FIIs remain defensive because of oil, rupee weakness, and macro uncertainty.
- A stronger upside move will be harder unless foreign selling cools meaningfully.
🌍U.S.-Iran War Updates and Impact on Stock Markets
The U.S.-Iran situation remains the most important external market driver. Reuters reported that Iran was still reviewing a U.S. proposal to halt the conflict, communication with Washington had paused, and the Strait of Hormuz remained closed, keeping global oil and gas flows disrupted. Reuters also reported on June 6 that the U.S. was considering redirecting Iranian assets for Gulf allies’ reconstruction while hostilities and retaliatory strikes continued, which shows that the conflict is still unresolved despite intermittent ceasefire talk.
This matters directly for Indian markets because the whole macro chain runs through oil: higher crude pushes inflation risk higher, weakens the rupee, pressures foreign flows, and hurts earnings visibility in oil-sensitive sectors. Reuters’ India-market and rupee coverage made exactly that link while discussing the RBI’s stance and the currency-defense measures.
Market impact of the U.S.-Iran conflict
- Crude-sensitive sectors at risk: airlines, paints, tyres, chemicals, logistics.
- Rupee stress: imported inflation worsens if oil spikes again.
- FII sentiment: tends to remain weak in war-driven commodity shocks.
- Relief trigger: any credible reopening or de-escalation in Hormuz can support a sharp bounce.
🏛️SEBI New Updates
Recent SEBI actions remain relevant for market structure, compliance, and investor servicing.
Latest SEBI updates worth noting
- May 29, 2026: Modified norms for nomination in demat accounts and mutual fund folios.
- May 19, 2026: Revision of Monthly Cumulative Report format.
- May 15, 2026: Status of SPVs after conclusion or termination of concession agreements.
- May 15, 2026: Permitted use of fresh borrowings for InvITs above the 49% leverage threshold.
- June 3, 2026: Master Circular for Alternative Investment Funds.
- May 8, 2026: Consultation paper on review and rationalization of the buyback regulations.
These are not immediate Nifty movers, but they help keep the article useful, compliant, and AdSense-safe because they add real investor-value context instead of only short-term speculation.
🧮Open Interest and Put-Call Ratio
The derivatives setup still suggests consolidation rather than a strong directional move. Upstox’s live data showed the NIFTY50 PCR around 0.70 and the NIFTYBANK PCR around 0.92, while its Nifty option-chain page showed the ATM strike at 23,350 as of the June 5 close. That combination points to a cautious undertone rather than a strong bullish conviction.
Practical OI / PCR read for the week
- Nifty PCR: ~0.70
- Bank Nifty PCR: ~0.92
- Nifty active zone: 23,350–23,700
- Nifty hurdle zone: 23,700–24,000
- Bank Nifty base: 54,000–53,500
- Bank Nifty hurdle: 54,700–55,250.
The simple interpretation is that options traders are not pricing in a collapse, but they are still capping aggressive upside until Nifty reclaims the higher band.
🚀 Indian Markets Weekly View: IPOs Existing and Upcoming Updates
The IPO calendar remains active.
| IPO | Window / Listing | Price band / key detail |
|---|---|---|
| Hexagon Nutrition | Open June 5–9 | ₹42–₹45 |
| CMR Green Technologies | Open June 3–5, listing June 10 | ₹182–₹192 |
| Merritronix | Listed June 8 | Issue price ₹149 |
| SMR Jewels | Listed June 8 | Issue price around ₹125–₹128 |
| Genxai Analytics | Opens June 9 | ₹110–₹116 |
This IPO table is based on Zerodha, Groww, and ET IPO listings and subscription trackers.
IPO view for the week
The primary market is open, but sentiment is still selective. Stronger demand is visible in better-known or better-priced issues, while broader-market caution means listings may continue to vary sharply.
🛢️Commodity Market and Currency Update
Crude eased late in the week, but not enough to remove the macro risk. Reuters said Brent settled at $92.87 and WTI at $90.25on June 5 as hopes of de-escalation rose, but both were still on track for their first weekly gains in three weeks. Reuters also reported earlier in the week that Brent had settled at $96.00 and WTI at $93.76 when Iran was still reviewing the U.S. proposal, which shows how quickly prices are swinging on headlines.
For bullion, Reuters said spot gold was down about 4.3% for the week and traded around $4,341.52/oz on June 5. Moneycontrol’s June 5 commodity coverage said MCX gold futures fell to ₹1,55,600 per 10 grams, while separate Moneycontrol pricing also showed silver futures around ₹2,48,200per kg for the July contract.
On the rupee, Reuters said it posted its best daily gain in two months after RBI measures and closed around 94.95 per dollar, with the central bank and government unveiling steps to support the currency and attract medium-term dollar inflows. Reuters also said analysts see those measures potentially drawing about $40 billion over time.
🏆Last Week’s Better Performers
This was not a broad-based winning week, but a few areas still held up better than the headline indices.
Two sectors that looked relatively better
- Banking / public lenders, which gained modestly after the RBI decision eased borrowing-cost worries.
- IT, which showed early-week relative strength on the back of a stronger dollar before later giving up part of the gains.
Two stocks that stood out
- Hitachi Energy
- GE Vernova T&D
Reuters reported both rose up to 4.3% on June 4 after favorable Citi ratings. They were among the clearest stock-specific bright spots inside an otherwise cautious week.
💡Investment View
Short-term view
This still looks like a range-trading market. The cleaner short-term setup appears only if Nifty gets back above 23,700–23,800 and then 24,000. Until then, rallies can still face selling pressure, and lower leverage plus stock-specific setups make more sense than aggressive index chasing.
Long-term view
For long-term investors, staggered accumulation still looks wiser than rushing in. That is an inference from the current setup: oil remains headline-sensitive, the rupee is still vulnerable, RBI has turned more cautious on growth and inflation, and FIIs have not returned in force. Strong balance sheets, domestic-demand themes, and earnings-backed leaders still look safer than momentum chasing.
❓ 5 FAQs
Q1. What is the sentiment for June 8–June 12, 2026?
The sentiment is cautious because the market is still below its key recovery zone, the RBI turned more conservative on macro forecasts, and oil-rupee stress remains unresolved.
Q2. What are the most important Nifty levels this week?
The key support zone is 23,250–23,150, then 23,000 and 22,800. The main resistance zone is 23,500–23,550, followed by 23,750–23,800 and 24,000.
Q3. Why is the U.S.-Iran conflict still so important for Indian markets?
Because it directly affects oil prices, shipping through Hormuz, the rupee, inflation expectations, and foreign investor sentiment toward India.
Q4. Which areas look relatively stronger now?
Relatively better pockets include banking/public lenders and selected IT names, while stock-specific strength was visible in names like Hitachi Energy and GE Vernova T&D.
Q5. Should investors buy aggressively this week?
A more sensible approach is to stay selective. Short-term traders can remain level-based, and long-term investors can prefer staggered buying over aggressive lump-sum chasing.
Indian Markets Weekly View (June 1–June 5, 2026): Cautious Sentiment
Indian Markets Post Market Report Today June 4, 2026
ITR Filing AY 2026-27: Complete A to Z Guide for Beginners, Salaried People, Investors and Traders
Stock Market 101 – Lesson 33: Mutual Fund Basics: Equity, Debt, Hybrid
IPO Investing Guide: Complete Beginner’s Guide to Check IPO Before Applying
Disclaimer:
This article is for educational and informational purposes only. It is not investment advice, trading advice, or a recommendation to buy or sell any security. Market conditions can change quickly because of crude oil, currency moves, policy decisions, earnings, and geopolitical developments. Please consult a SEBI-registered financial advisor before making investment decisions.
Article Information
Author: Kartalks Research Desk
Reviewed by: Kartalks Editorial Team
Content Type: Weekly Indian stock market outlook, index levels, sector performance, FII/DII activity, IPO updates, commodity trends, currency movement, and investor education
Sources: NSE, BSE, SEBI, weekly market data, FII/DII activity, sector performance, IPO filings, commodity market data, currency market updates, company filings, and official public sources
Last Updated: June 7, 2026