Q3FY26 Results Deep-Dive: SBI, BSE, KPIT, Deepak Fertilizers & Tata Steel (with CMP, Fundamentals, Technicals, Peers & Key Levels)
Quick snapshot (Q3 FY26 + CMP + 52-week range)
SBI (State Bank of India)
CMP (Prev Close): ₹1,198.60
52W range: ₹680.00 – ₹1,203.70
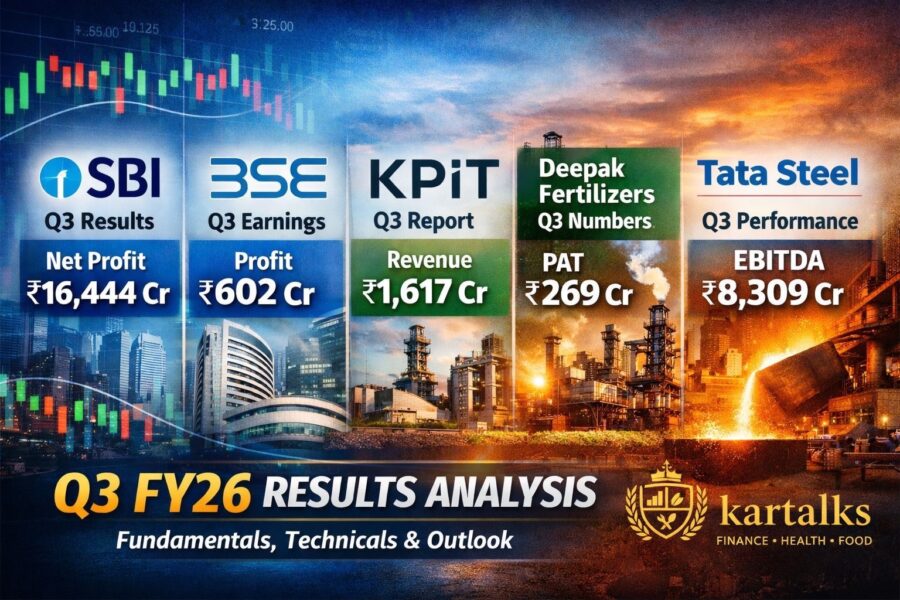
Q3 FY26 highlight: Net profit ₹16,444 crore, NII up, provisions eased (key support from lower credit costs).
BSE Ltd
CMP (Prev Close): ₹3,025.30
52W range: ₹1,227.33 – ₹3,227.00
Q3FY26 results highlight: Net profit ₹602.49 crore, total income ₹1,334.09 crore (strong operational momentum).
KPIT Technologies
CMP (Prev Close): ₹861.70
52W range: ₹812.90 – ₹1,434.50
Q3 FY26 highlight: Revenue ₹1,617 crore, EBITDA margin 19.5%, PAT ₹133 crore (reported), deal wins/TCV $202 mn.
Deepak Fertilisers & Petrochemicals (DFPCL)
CMP (Prev Close): ₹1,030.80
52W range: ₹888.90 – ₹1,778.60
Q3 FY26 highlight: Net sales ₹2,358.81 crore, net profit ₹269.13 crore, EBITDA ₹498.50 crore.
Tata Steel
CMP (Prev Close): ₹203.18
52W range: ₹125.30 – ₹211.10
Q3 FY26 highlight: Revenue ₹57,002 crore, EBITDA ₹8,309 crore, PAT ₹2,730 crore, net debt ₹81,834 crore.
1) SBI Q3 FY26: Results, what went right, and what to watch
Q3 FY26 key results (why the quarter mattered)
SBI reported Q3 FY26 net profit of ₹16,444 crore, supported by stronger core income and a moderation in provisions.
What investors usually track in SBI results
Core earnings strength: Net interest income (NII) and NIM trajectory.
Asset quality: Slippages, GNPA/NNPA trend, and provisioning intensity.
Loan growth + deposit mix: Whether credit growth is funded comfortably, and how CASA behaves.
Fundamentals view (simple)
Strengths: Scale, improving credit-cost cycle vs past, diversified loan book.
Risks: NIM compression if deposit costs stay sticky, and higher competition in retail/corporate pricing.
Technical view + key levels (based on recent price behavior)
CMP (Prev Close): ₹1,198.60
Near support zones: ₹1,185 (recent day low zone), then ₹1,150–₹1,120 (psychological + retracement zone).
Near resistance zones: ₹1,201–₹1,204 (recent high / 52W high area).
Peer comparison (quick reality check)
Better to compare SBI against large banks for cycle + valuation comfort:
HDFC Bank (stable compounding, premium valuation)
ICICI Bank (strong RoA/RoE cycle)
Bank of Baroda (PSU peer, more cyclicality)
Forecast lens (next 1–2 quarters)
If credit costs remain controlled, SBI’s earnings quality stays strong; the key swing factor is NIM direction + deposit cost pressure.
FAQs
Is SBI profit growth “one-off”?
A big driver was lower provisioning intensity; sustainability depends on asset quality staying clean and NIM not falling sharply.What’s the #1 monitor point after results?
Watch the credit-cost trend and NIM commentary each quarter—these move valuation fast.
2) BSE Q3 FY26: Exchange business is a volume + operating leverage story
Q3 FY26 key results
BSE posted ₹602.49 crore net profit on ₹1,334.09 crore total income in Q3 FY26.
What drove the quarter (business model in one minute)
Exchanges have high operating leverage: when volumes rise, incremental revenue often drops strongly to the bottom line.
Growth drivers usually include:
Cash market and derivatives participation (turnover/transactions)
Listing-related income (depending on cycle)
Data/information and ecosystem businesses
BSE’s investor presentation and commentary track these levers closely.
Fundamentals view
Strength: Operating leverage + structurally rising market participation in India.
Risk: Volume/fee pressure and competitive intensity across products.
Technical view + key levels
CMP (Prev Close): ₹3,025.30
52W range: ₹1,227 – ₹3,227
Support zones: ₹3,020–₹3,000 (recent day low band), then ₹2,900 (round number).
Resistance zones: ₹3,127–₹3,227 (near top of the recent range / 52W high).
Peer comparison
Exchange/market-infrastructure comps to sanity-check valuation + cycle:
Central Depository Services (India) Ltd
Multi Commodity Exchange of India Ltd
(NSE is the closest peer but unlisted.)
Forecast lens
BSE’s earnings trajectory usually tracks market participation, derivatives adoption, and product momentum. The big question: can the platform keep expanding share and monetisation without fee pressure.
FAQs
Why do exchange stocks move sharply after results?
Because small changes in volumes/fees can translate into large profit swings due to operating leverage.What is the key “leading indicator”?
Weekly/monthly turnover and transaction trends (cash + derivatives), plus any product-share commentary.
3) KPIT Q3 FY26: Auto-tech deal wins matter as much as margins
Q3 FY26 key results
KPIT delivered:
Revenue ₹1,617 crore
EBITDA margin 19.5%
PAT ₹133 crore (reported) and ₹193 crore (adjusted)
New deal wins / TCV $202 mn
Management briefing takeaways (what the market listens for)
For ER&D/auto-tech IT companies, the market typically cares about:
Deal wins (TCV) and conversion to revenue
Client concentration + EV/software cycle
Margin stability (hiring, onsite/offshore mix, utilisation, and currency)
KPIT’s commentary around wins and pipeline is a key driver of forward expectations.
Fundamentals view
Strength: Positioning in auto software, embedded, mobility transformation.
Risk: Auto cycle softness or delayed program ramps; valuation sensitivity when growth slows.
Technical view + key levels
CMP (Prev Close): ₹861.70
52W range: ₹812.90 – ₹1,434.50
Support zones: ₹813–₹820 (52W low zone), then ₹780 (if weakness persists).
Resistance zones: ₹950–₹980 (near upper circuit/short-term zone from recent data), then ₹1,050+ (bigger trend reversal area).
Peer comparison
Useful peers for a “growth + valuation” lens:
Tata Elxsi
Persistent Systems
L&T Technology Services
Forecast lens
KPIT’s near-term trend will likely depend on deal conversion pace and margin defence. A strong TCV quarter is good—but the market tends to reward consistency: wins → ramps → revenue visibility.
FAQs
Is KPIT more “growth” or “quality”?
It’s a growth-oriented ER&D play; returns can be strong, but drawdowns can be sharp when the auto-tech cycle slows.What should long-term investors track quarterly?
Deal wins/TCV, client additions, and margin band commentary.
4) Deepak Fertilisers Q3 FY26: Watch margins, TAN cycle, and cash flows
Q3 FY26 key results
Deepak Fertilisers reported:
Net sales ₹2,358.81 crore
Net profit ₹269.13 crore
EBITDA ₹498.50 crore (strong margin profile for the quarter)
Management briefing highlights (practical)
From the earnings transcript, management commentary includes focus on business performance and operational priorities.
What usually moves the stock here
Product spread cycles (fertilisers + industrial chemicals)
Volume ramp, pricing environment, and input costs
Capex/expansion and balance sheet comfort
Fundamentals view
Strength: When the cycle is favorable, operating leverage lifts earnings quickly.
Risk: Cyclical pricing; sharp mean reversion is common in chemical/fertiliser names.
Technical view + key levels
CMP (Prev Close): ₹1,030.80
52W range: ₹888.90 – ₹1,778.60
Support zones: ₹1,023–₹1,020 (recent low band), then ₹890 (52W low).
Resistance zones: ₹1,050–₹1,100 (near-term supply), then ₹1,250 and above (bigger recovery zone). 👉moneycontrol
Peer comparison
For a “theme + cycle” lens, compare with:
Coromandel International
Chambal Fertilisers & Chemicals
Gujarat State Fertilizers & Chemicals
Forecast lens
Deepak Fertilisers’ next leg depends on margin sustainability and management’s view on demand/cycle. Q3 was strong; the question is whether spreads normalize or stay supportive.
FAQs
Why is the stock still far from 52W high despite good quarter?
The market prices in cycle risk early—investors want clarity that margins are sustainable, not just a one-quarter spike.What’s the most important metric next quarter?
EBITDA margin trend + cash flow conversion (profits should translate to cash over time).
5) Tata Steel Q3 FY26: Strong quarter + monitor Europe and net debt
Q3 FY26 key results (official)
Tata Steel reported:
Revenue ₹57,002 crore
EBITDA ₹8,309 crore
PAT ₹2,730 crore
Net debt ₹81,834 crore
Management briefing: what the market takes away
Steel is a cycle + execution story. Investors focus on:
India realisations, volume, cost control
Europe operations trajectory
Net debt and capex discipline
Tata Steel’s results communication highlights both performance and balance sheet metrics.
Fundamentals view
Strength: Improving profitability as demand/pricing stays supportive.
Risk: Steel spreads can change quickly; Europe remains a key swing factor.
Technical view + key levels (with moving averages)
CMP (Prev Close): ₹203.18
52W high/low: ₹211.10 / ₹125.30
Trend support (DMAs): 20 DMA ~ ₹195, 50 DMA ~ ₹182.8 (bullish structure if price holds above these).
Support zones: ₹202–₹195, then ₹183
Resistance zones: ₹211, then ₹220+ if breakout sustains.
Peer comparison
For steel-cycle context:
JSW Steel
Steel Authority of India
Jindal Steel & Power
Forecast lens
If demand remains steady and input costs don’t spike, near-term momentum can stay constructive—but keep an eye on spreads and debt trajectory (steel rewards discipline). 👉Tata Steel
FAQs
Why does Tata Steel react sharply to global cues?
Because steel prices, coking coal, and global trade flows can change quickly—earnings are sensitive.What’s the cleanest “bull case” trigger?
Sustained India strength + improving Europe performance + steady net debt trend.
Which one to choose for investment? (practical, profile-based)
If you want “stability + reasonable valuation” (core portfolio)
SBI: Large bank cycle improving; watch NIM/credit cost.
If you want “market infra / operating leverage” (high conviction, higher volatility)
BSE: Strong profit print; moves with market activity and competitive dynamics.
If you want “growth stock” exposure (higher risk, higher reward)
KPIT: Deal wins and execution are key; drawdowns can be deep if growth slows.👉kpit
If you want “cyclical turnaround / margin play”
Deepak Fertilisers: Strong Q3, but cycle risk is real—position sizing matters.
If you want “macro/cycle play with strong technical momentum”
Tata Steel: Good quarter + trend strength; monitor spreads and debt.
Bottom line (simple)
Best defensives among these: SBI (relative stability)👉Trading view
Best “market activity” proxy: BSE
Best growth bet (with risk): KPIT
Best cyclical-earnings swing: Deepak Fertilisers
Best commodity-cycle momentum: Tata Steel
👉Further reading
Q3 FY26 Results Snapshot: Axis Bank, Bharti Airtel & Bajaj Finance
Stock Market 101 – Lesson 17: Trading Psychology (Biases, FOMO, and Discipline)
Disclaimer:
This article is for education and information only, not investment advice. Markets are risky; please do your own research or consult a SEBI-registered advisor before taking any buy/sell decision.