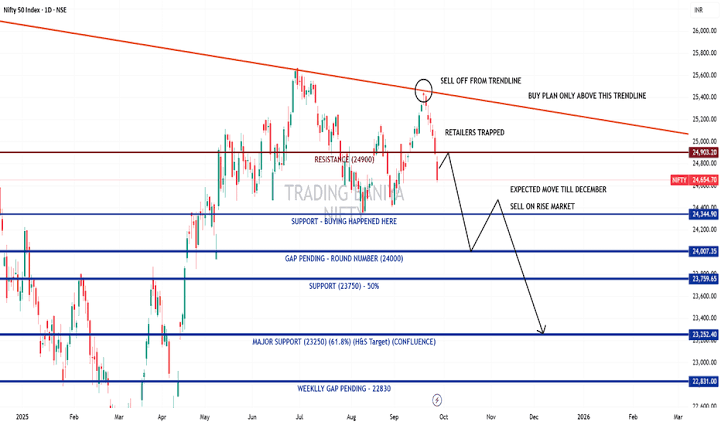
This week Indian equities ended widespread weakness.
About 440 Stocks ended in Red in BSE 500 index and 17 Stocks dropped more than 10% in the week.
In IT and Pharma sectors the pressure was continued. Which underperformed sharply and dragged down broader indices.
Markets hit multi-week lows,confirming that the recent downtrend is not just a short build up but part of a more extended correction phase.
📉 Technical pattern and weekly chart observations.
Based on weekly chart.
The major indices have broken key support zones formed over recent weeks. Day candlestick pattern show strongly RED weekly bars – a sign that sellers dominated. The trend is decisively negative until proven otherwise.
In short: The weekly chart is flashing caution lights. Until bulls reclaim those support zones with strength, the trend remains downward.
⚙ Key Drivers That Shaped The Week
U.S.Tariff/Trade Policy Shocks:
New import tariffs and policy changes from the U.S. rattled exports oriented and pharma names
FII Outflows: Consistent selling by foreign institutional investors added stress.
Sector rotation/ weakness:
Pharma and IT underperformance pulled broad markets down; defensive sectors held somewhat better but weren’t strong enough.
VIX UP:
Indian VIX and implied volatilities rose, reflecting elevated fear and uncertainty.
🔍 What This Means for Next Week
Watch whether indices attempt to reclaim former supports; if they fail and turn them into resistance, further downside is likely.
Key levels to monitor:
The broken supports, and lower supports where prices may stall.
Sector leaders or RSI might offer safe bounce opportunities – but broad participation will be needed to sustain any recovery.
Keep on eye on FII flows and global cues ( US yields, dollar index, fed signals) and commodities prices behaviour for direction.
📈 Weekly Chart Insights & Levels.
Nifty 50
The index recently broke below a support band that held over the past few months.
Support Levels to watch: ~ 24,600 to 24,900
Resistance levels:~25,000 to 25,200
SENSEX
Support Levels: ~ 80,400 to 81,500
Resistance Levels: ~ 82,500 to 83,000
Bank Nifty
Support Levels: ~ 54,200 to 55,00
Resistance Levels: ~ 55,800 to 56,500
Volatility may stay elevated- expect sharp intra-week swings rather than smooth trends.

